Front. Genet.,
23 October 2020 | https://doi.org/10.3389/fgene.2020.567309
Y-Chromosome Genetic Analysis
of Modern Polish Population
![]() Łukasz Grochowalski1,
Łukasz Grochowalski1, ![]() Justyna Jarczak1,2,
Justyna Jarczak1,2, ![]() Maria Urbanowicz1,
Maria Urbanowicz1, ![]() Marcin Słomka1,2,
Marcin Słomka1,2, ![]() Maria Szargut3,4,
Maria Szargut3,4, ![]() Paulina Borówka5,
Paulina Borówka5, ![]() Marta Sobalska-Kwapis1,2,
Marta Sobalska-Kwapis1,2, ![]() Błażej Marciniak1,2,
Błażej Marciniak1,2, ![]() Andrzej Ossowski3,4,
Andrzej Ossowski3,4, ![]() Wiesław Lorkiewicz5 and
Wiesław Lorkiewicz5 and ![]() Dominik Strapagiel1,2*
Dominik Strapagiel1,2*
·
1Biobank Lab, Department of Molecular Biophysics,
Faculty of Biology and Environmental Protection, University of Lodz,
Łódź, Poland
·
2BBMRI.pl Consortium, Łódź, Poland
·
3Department of Forensic Genetics, Pomeranian Medical
University in Szczecin, Szczecin, Poland
·
4The Polish Genetic Database of Totalitarianism
Victims, Szczecin, Poland
·
5Department of Anthropology, Faculty of Biology and
Environmental Protection, University of Lodz, Łódź, Poland
The study
presents a full analysis of the Y-chromosome variability of the modern male
Polish population. It is the first study of the Polish population to be
conducted with such a large set of data (2,705 individuals), which includes
genetic information from inhabitants of all voivodeships, i.e., the first
administrative level, in the country and the vast majority of its counties,
i.e., the second level. In addition, the available data were divided into
clusters corresponding to more natural geographic regions. Genetic analysis
included the estimation of FST distances, the
visualization with the use of multidimensional scaling plots and analysis of
molecular variance. Y-chromosome binary haplogroups were classified and
visualized with the use of interpolation maps. Results showed that the level of
differentiation within Polish population is quite low, but some differences
were indicated. It was confirmed that the Polish population is characterized by
a high degree of homogeneity, with only slight genetic differences being
observed at the regional level. The use of regional clustering as an
alternative to counties and voivodeships provided a more detailed view of the
genetic structure of the population. Those regional differences identified in
the present study highlighted the need for additional division of the
population by cultural and ethnic criteria in such studies rather than just by
geographical or administrative regionalization.
The structure
and variability of the modern Polish population have arisen as a result of the
demographic and political changes that have formed the populations of this part
of Europe. Poland was first regarded as a nation with the beginning of the
Piast state (the so-called first Polish state) in the 10th century AD. The early history of the
inhabitants of the land between the Oder and Bug rivers is inseparably
connected with the discussion on the ethnogenesis of the Slavs. According to
the autochthonous hypothesis, the Slavs developed and lived in the Oder and
Vistula basins, and their roots in this area extend back to 1,200 to 1,000
years BC. In contrast, the
allochthonous theory assumes that the Slavs arrived in this area between the
fifth and sixth century CE from the Upper Dnieper basin, an area believed
to be their cradle (Trzeciecki, 2016). This 100-year-old discussion
has recently been joined by anthropologists and geneticists studying modern
mtDNA and Y-chromosome polymorphisms (Malyarchuk et al., 2002, 2008; Branicki et al., 2005; Grzybowski et al., 2007; Rebala et al., 2007, 2013;Wozniak et al., 2010; Mielnik-Sikorska et al., 2013a) and recently also ancient
DNA (Juras et al., 2014).
Polish modern
history, especially during the last 200 years, was rich in dramatic events such
as wars, occupations, borders shifting, and political migrations. However, the
greatest influence for the shaping of modern demographic situation had
consequences of World War II (WWII). Until that time, population of Poland was
an ethnic, religious, and linguistic mosaic, in which people have coexisted
together for centuries [native Polish in 1939-65.5% population (Polish Ministry of Information, 1941)]. The final number of
victims during WWII was estimated at more than 6 million of Polish citizens (Polish War Reparations Bureau, 1947), which meant greater than
17% of prewar population of Poland (Polish Ministry of Information, 1941). Because of hostilities,
young men constituted a large part of this number whose death resulted in
significant depletion of gene pool (Diepenbroek et al., 2019).
Furthermore, the
borders of Poland have been radically shifted, which triggered significant
demographic changes such as mass resettlements and human migrations. Therefore,
millions of people of different ethnicity were suddenly forced to leave their
immemorial residence in mass migrations (Eberhardt, 2000). In years 1944–1948, from lands
that belonged to Poland before the WWII and have been incorporated to Soviet
Republics, around 800,000 Polish people have been officially resettled from
Ukrainian SSR (Kersten, 1974; Czerniakiewicz, 1987), which means as much as 96%
people registered there for transfer (Piesowicz, 1988). The official migrants were
resettled to area between Upper and Lower Silesia (Hryciuk et al., 2008). From the Byelorussian SSR,
around 300,000 of Polish people have been resettled (33.5% registered for
transfer) (Kersten, 1974; Czerniakiewicz, 1987; Piesowicz, 1988) to Lower Silesia, western
part of Greater Poland, Lubusz, Szczecin in West Pomerania, and Gdańsk in
Pomerania (Hryciuk et al., 2008). From Lithuanian SSR, around
200,000 of Polish people have been resettled (51.5% registered for transfer) (Kersten, 1974; Czerniakiewicz, 1987) to Warmian–Mazurian, Pomerania, and some of them to Lower Silesia (Hryciuk et al., 2008). Moreover, around 250,000 of
Polish people have been also officially resettled from the Soviet Union (Kersten, 1974) (Supplementary Figure S1). About 3 million people also
moved there from the rest of Polish territory, comparing almost 1.2 million of
native Polish who have already lived in Upper Silesia and Warmian–Mazurian as
the indigenous (Kosiński, 1960;Eberhardt, 2000). Furthermore, at the same
time almost 2 million Polish people returned to Poland from Western Europe (Kersten, 1974) (Supplementary Figure S2). In years 1955–1959, the
next wave of resettlements took place, and 250,000 native Polish have been
displaced from the Soviet republics to the new western Polish lands (Latuch, 1994) (Supplementary Figure S1). Other ethnic populations
have been displaced in the same way: several millions of Germans moved from new
Polish lands to Germany and majority from around 700,000 indigenous Ruthenians
and Ukrainians from Subcarpathian were resettled to Ukrainian SSR and 140,000
in operation “Wisła” forcely moved to Lower Silesia, West Pomerania, and Warmian–Mazurian (Eberhardt, 2000) (Supplementary Figure S2).
In summary, in
Poland within the past 80 years, more than 11 million people of both Polish and
non-Polish descendance have been moved either to or from the country (Ploski et al., 2002). The genetic structure of
the country has changed between the prewar and postwar period dramatically (Rebala et al., 2013; Diepenbroek et al., 2019).
Modern
population studies are often based on genome-wide analysis studies, most
commonly employing single-nucleotide polymorphism (SNP) microarray technology;
this approach is capable of identifying disease-related or trait-related
variants and is essential for the advancement of personalized or forensic
medicine (Tam et al., 2019). However, analysis of the
SNPs related with an allosome locus can also be of great value in
anthropological and forensic research, as they appear to carry key information
about the genetic diversity of a certain population. Knowledge of the
phylogenies of the paternally inherited portion of the non-combining region of
chromosome Y (NRY) can be acquired by examining the patterns of Y-short tandem
repeats (Y-STR); these are subject to a higher mutation rate and thus
demonstrate higher typing resolution than the more slowly evolving
Y-chromosomal biallelic polymorphisms (Rosser et al., 2000; Gill et al., 2001).
Previous studies
tracing paternal lineages and kinship in different parts of the country have
analyzed Y-STR haplotype and allele frequencies of Polish men (Pepinski et al., 2004b; Rebala and Szczerkowska, 2004; Wozniak et al., 2007; Soltyszewski et al., 2008; Wolanska-Nowak et al., 2009), as well as studies
performed on the representatives of selected cities (Ploski et al., 2002; Kayser et al., 2005; Rebala and Szczerkowska, 2005), and among ethnic groups (Rebala et al., 2007, 2013; Janica et al., 2008), minorities, and residents (Pepinski et al., 2004c,2005a,b; Janica et al., 2006). These studies have
typically employed residual polymerase chain reaction (PCR)–based Y-chromosomal
biallelic polymorphism estimation (Rosser et al., 2000), autosomal (Behar et al., 2013), and whole-genome approaches
(Lao et al., 2008).
Our study
presents a full analysis of the Y-chromosome variability of the modern male
Polish population. It is the first study of the Polish population to be
conducted with such a large set of data (2,705 individuals), which includes
genetic information from inhabitants of all voivodeships, i.e., the first
administrative level, in the country and the vast majority of its counties,
i.e., the second level. In addition, the available data were divided into
clusters corresponding to more natural geographic regions. The obtained
results, as yet unpublished, estimate the missing genetic variability of the
modern Polish population and examine the genetic relationships between its
members, allowing researchers to shed light on the historical, demographic, and
social changes that have occurred during the turbulent history of the country.
They represent an excellent complement to earlier mtDNA studies on the
diversity of the Polish population (Jarczak et al., 2019).
Subjects
Adult
participants were recruited between 2010 and 2012 under the TESTOPLEK project
based on general Polish population—POPULOUS collection of 10,000 saliva
samples, derived from female and male attendees, completed with individual
in-depth interview based on questionnaires. These recorded their place of
residence, together with various other questions about the origin or ancestry
of parents and grandparents. Saliva samples were collected up to 2016 and
collectively have been included to POPULOUS collection at the Biobank Lab of
the Department of Molecular Biophysics of the University of Lodz (Strapagiel et al., 2016;Dobrowolska et al., 2019), which is currently
registered in Directory (v. 4.0) of BBMRI-ERIC consortium under
bbmri-eric:ID:PL_BLUL:collection:POPULOUS_BLUL registration number. Approval
for this study was obtained from the University of Lodz Ethics Review Board.
All procedures were performed in accordance with the Declaration of Helsinki
(ethical principles for medical research involving human subjects).
Finally, a group
comprising 2,705 adult male inhabitants of all 16 Polish voivodeships was
assembled for the present study. These participants were found to represent 337
of 380 counties (in Polish: powiaty). The regional data were
assembled into 40 clusters, thus providing a high-resolution overview of the
diversity of modern-day male Polish population (Supplementary Figure S3).
Clustering and Visualization
Cluster
formation allowed data from counties with low sample sizes to be merged, to
provide a greater density of points than analysis based on voivodeships alone.
The data from the counties were merged into 40 clusters using the K-means
method (Jarczak et al., 2019).
Clustering was
carried out using Python (v.3.7.4) with Scikit-learn
package (Pedregosa et al., 2011). The approach resulted in
the formation of a number of regions, whose lowest cluster size was 30, and the
most numerous was 301. The list of counties and their resulting clusters can be
found in Supplementary Table S1.
The geographical
representation of the haplogroup frequencies was performed using QGIS
(v.2.18.16). Surface interpolation was carried out using the Inverse Distance
Weighted method on a valid administrative map of Poland downloaded from the
Geodesic and Cartographic Documentation Center website. The longitude and
latitude of the counties were obtained with the Google Maps Api.
Sampling and Genotyping
Saliva was
collected from each individual using Oragene OG-500 DNA storage probes. Genomic
DNA was manually extracted with PrepitL2P® (PD-PR-052, DNA Genotek,
Canada), and the samples were genotyped using Infinium HTS Human Core Exome
PLUS microarrays (Illumina, Inc., San Diego, CA, United States), according to
the manufacturer’s protocol. Quality control of obtained results was performed
by examining raw fluorescence intensities in GenomeStudio (v.2011.1) with
Genotyping Module (v.1.9.4) (Illumina, Inc.); all samples met the criteria,
demonstrating a call rate greater than 0.98 with the 10% GenCall parameter
above 0.4. A total of 1,755 SNPs (Supplementary Table S2) located on the Y-chromosome
passed QC and were included in the analysis. StrandScript
(Wang et al., 2017) was used to correct strand
orientation. The full set of data from genotyping can be found at the European
Genotype Archive—the accession number for the Y chromosome microarray data of
Polish population reported in this article is EGAS00001004111.
Bioinformatics Analysis
Genetic
variation between, and within, voivodeships and clusters was quantified by
analysis of molecular variance (AMOVA) using Arlequin
(v.3.5) (Excoffier and Lischer, 2010). Arlequin was also used to
calculate pairwise genetic distance (FST) for clusters and
voivodeships based on the obtained Y-SNP data (n = 1,755 SNPs). The
statistical significance of the Arlequin analysis was assessed using 10,000
permutations. The pairwise genetic distances were visualized by
multidimensional scaling (MDS) analysis using the cmdscale function in R
(v.3.4.2).
yHaplo (v.1.0.19) (Poznik, 2016) performed Y-SNP binary
haplogroup assignments on 496 informative SNPs. Haplogroup frequencies were
calculated for voivodeships and clusters. Links to all web resources mentioned
in the text are listed in Appendix A.
A total of 2,705
unrelated males from the Polish population with place of residence were
included in the study. The list of typed haplogroup for each sample is included
inSupplementary Table S3.
The analysis of allele distribution among the studied samples revealed 12
different haplogroups, of which R was divided into subhaplogroups R1a and R1b
for better resolution (Table 1).
TABLE 1
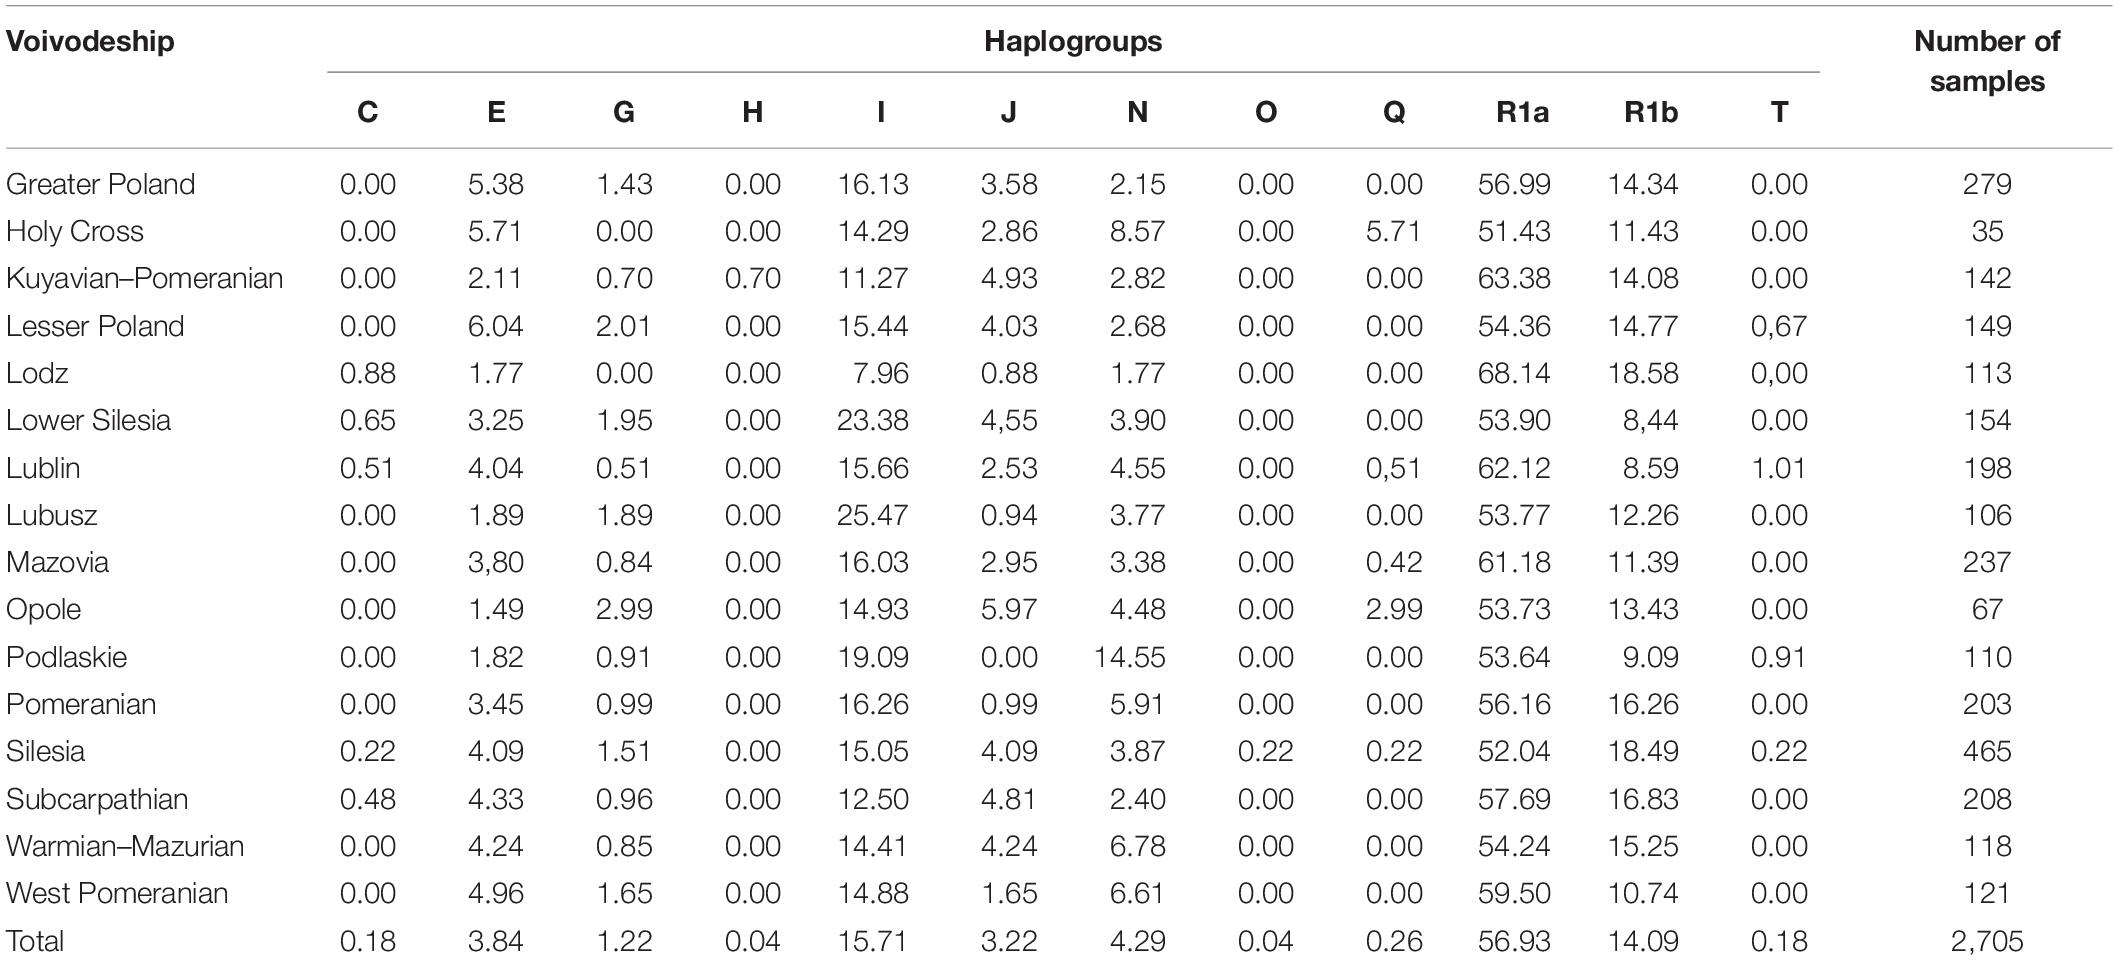
Table 1. Main haplogroups and
selected subhaplogroups frequencies for Polish population including division
into voivodeships (n = 2,705).
The most
frequent Y-SNP binary haplogroups in all analyzed samples were found to be R
(71.02%), I (15.71%), N (4.29%), E (3.84%), J (3.22%), and G (1.22%). The total
contribution of the others, viz. Q, C, T, H, and O, totaled
less than 1% (0.70%), and each comprised only individual samples (Table 1).
The samples were
divided to visualize the distribution of haplogroups according to voivodeship.
Most were characterized by the presence of six or seven haplogroups (hgs), with
only Silesia (10 hgs) and Lublin (9 hgs) being more diverse. While in Silesia
this high number may be attributed to the higher number of samples recorded,
Lublin, with one less haplogroup identified, recorded a similar number of
samples to the other voivodeships. Additionally, most of the voivodeships did
not differ with regard to the number of haplogroups, which suggests the
population is highly homogeneous (Table 1).
In all
voivodeships, hg R was the most common, with the highest frequency observed in
the Lodz voivodeship (86.72%) and lowest in Lower Silesia (62.34%) (Table 1). Interestingly, Lodz is
represented almost only by haplogroups R and I, accounting for 93.80% of the
samples.
A deeper
investigation of haplogroup distribution was carried out based on the clusters.
Haplogroup R is unevenly distributed in Polish population with the central part
of the country marked by the highest frequencies (Figure 1). When hg R was divided into
subhaplogroups, one can see that R1a is distributed mostly in the center part
of Poland with a few regions in the west and east of the country. R1b is most
widely distributed on the territory of Poland, reaching farther east and west (Figure 1).
FIGURE 1
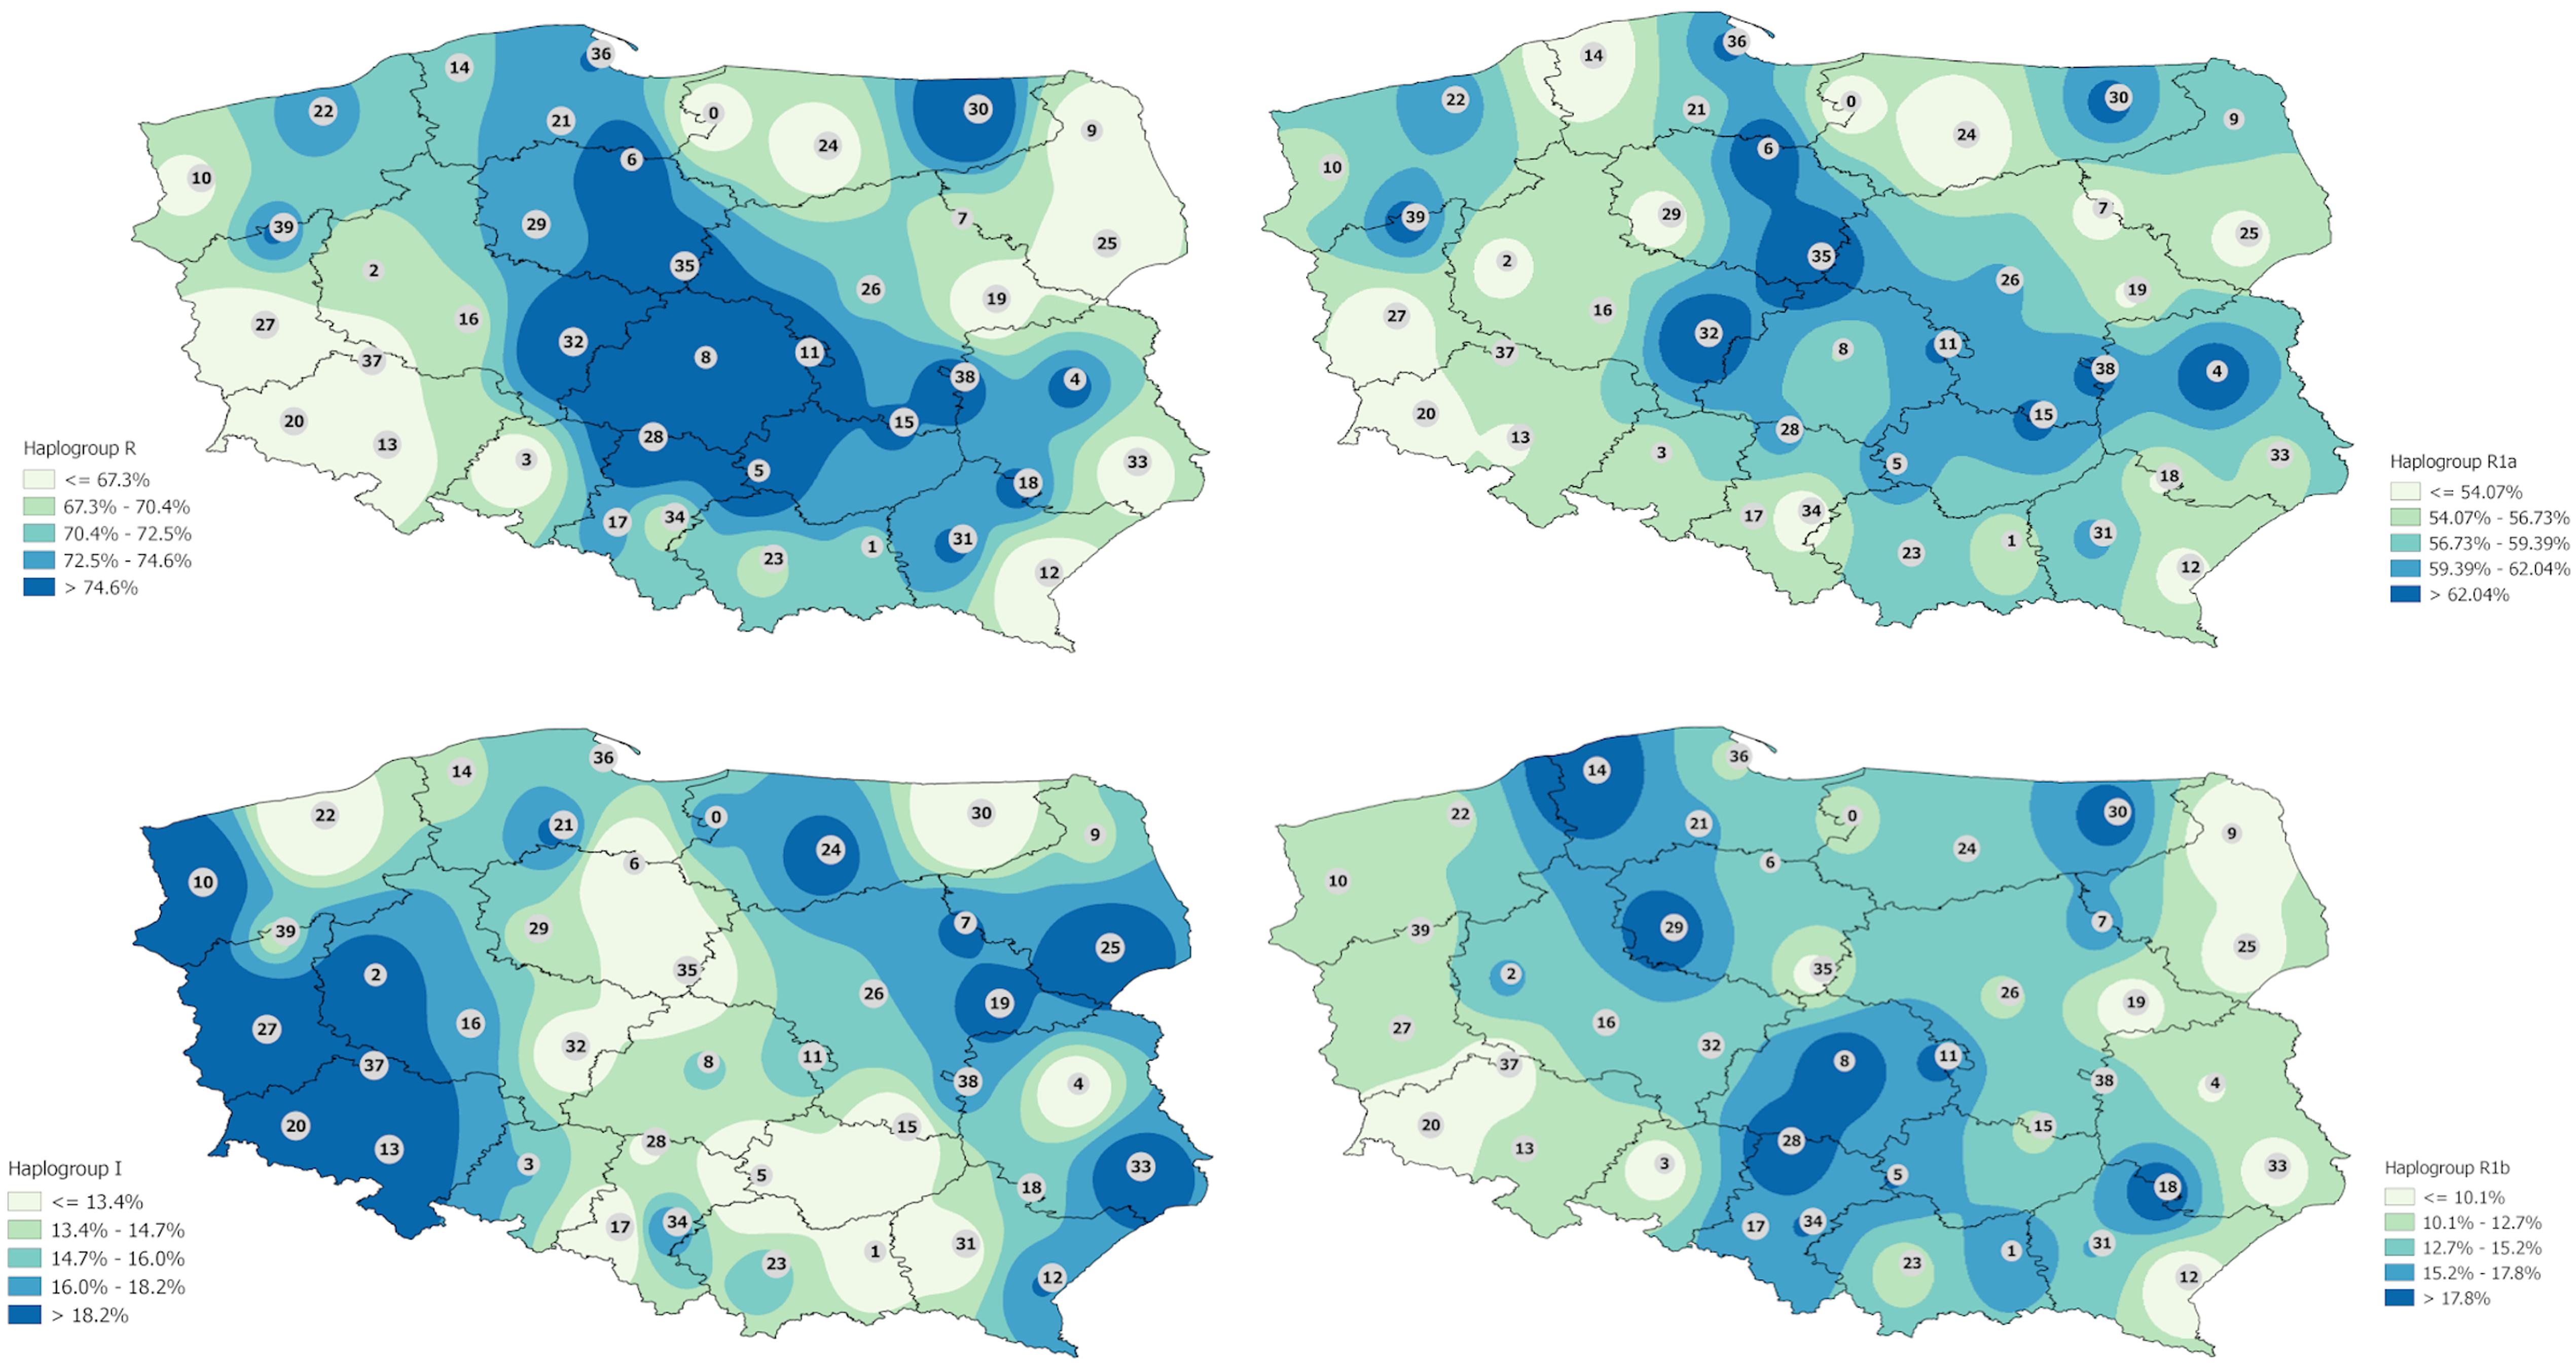
Figure 1. Interpolation maps for
the two main haplogroups (R and I) with the division (in case of hg R) into
subhaplogroups R1a and R1b observed in the Polish population.
Interpolation
map of haplogroup I shows that it is more evenly represented in the Polish
population but some trends are indicated. The highest frequencies are observed
in western Poland and in some regions of eastern Poland mostly in Podlaskie and
Lublin voivodeships but reaching also eastern parts of Mazovia, western parts
of Warmian–Mazurian, and almost all Subcarpathian (Figure 1). Haplogroup N is observed
mostly in all Podlaskie voivodeship. In the case of haplogroups E and J, the
differences are not so highlighted, and a much greater diversity of frequencies
is observed (Figure 2).
FIGURE 2
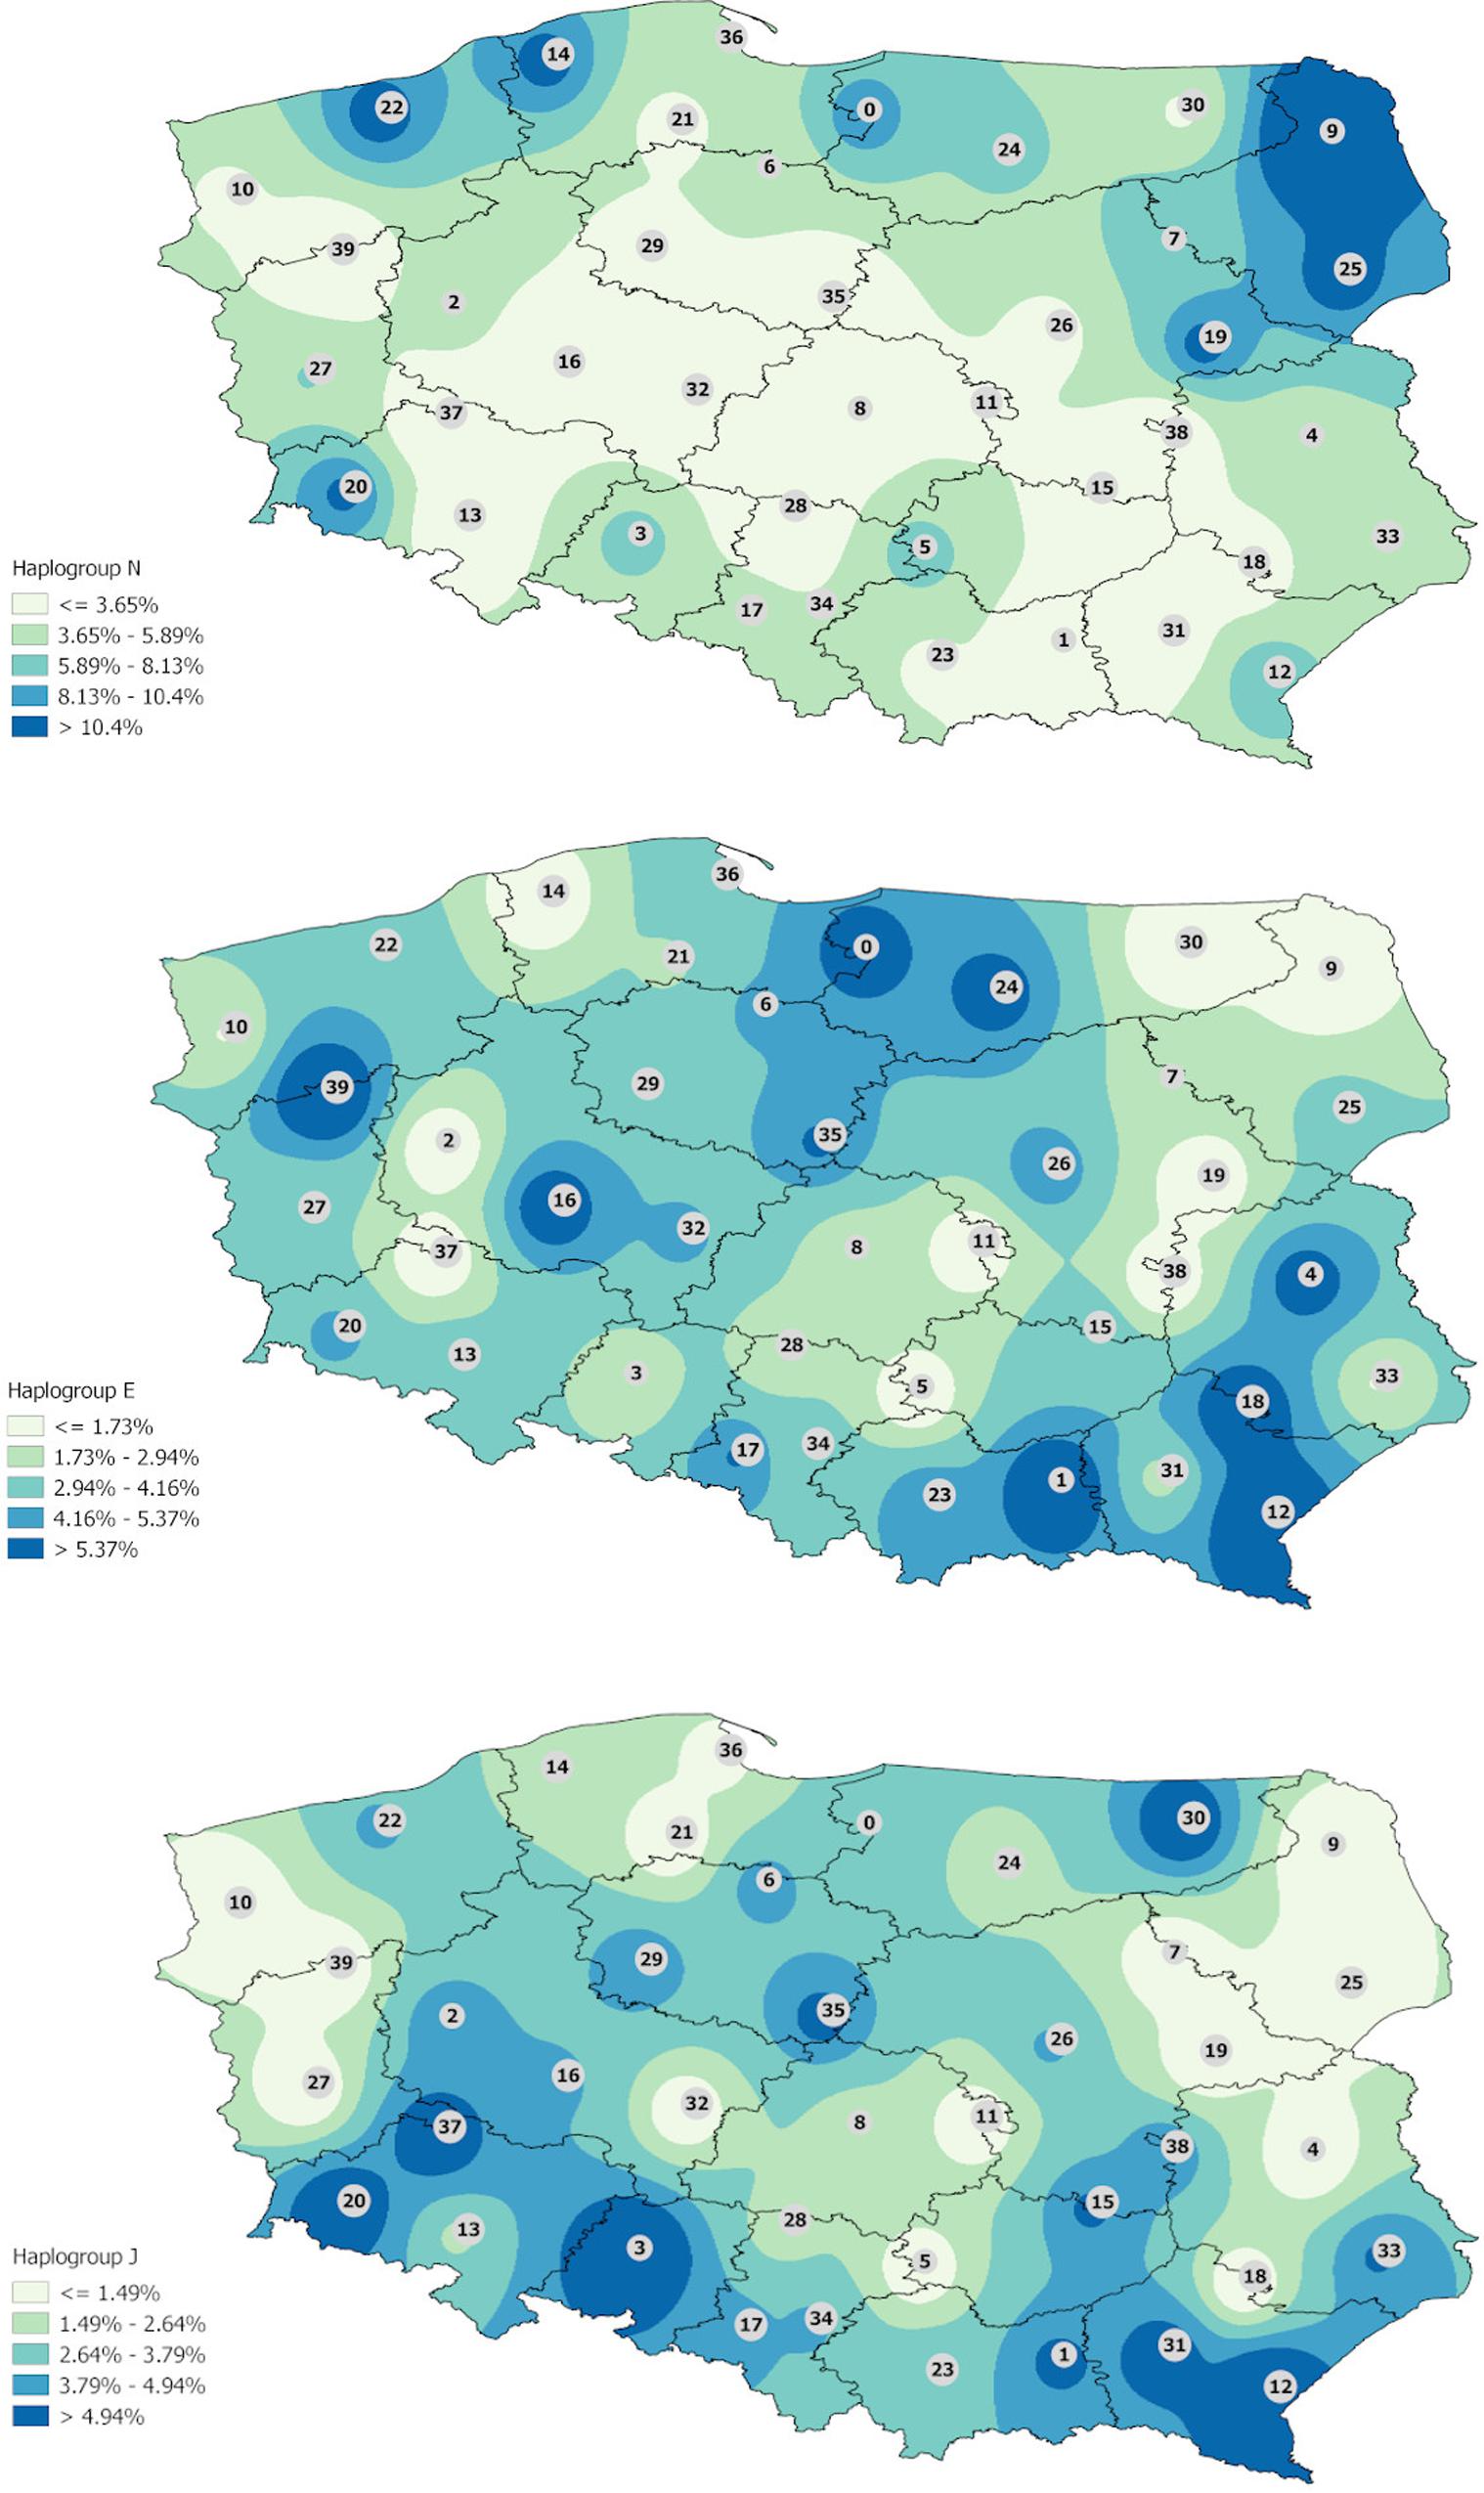
Figure 2. Interpolation maps for
the other main haplogroups (N, E and J) observed in the Polish population.
The maps
in Figures 1, 2 present an interpolated
distribution of the seven most frequent haplogroups in the Polish population.
Genetic Differences (FST)
To identify
changes in genetic distance across the population, voivodeships and clusters
were compared by the FST metric, which ranged
from 0.0001 to 0.09123, depending on the tested voivodeship
(Supplementary Table S4). The highest FST values were observed
between Lodz and Lower Silesia (FST = 0.09123; p <
0.00001), as well as between Lodz and Podlaskie (FST = 0.085; p <
0.00001) (Supplementary Table S4 and Supplementary Figure S4). The results identified Lodz
as an outlier, being significantly different to the 14 other voivodeships.
Lower Silesia demonstrated the second highest number of statistically
significant FST values. Only the Lodz and the
Kuyavian–Pomeranian voivodeship pair demonstrated no differences.
Furthermore, an
MDS plot, constructed on the basis of pairwise FST values, clearly shows
that most voivodeships form a compact group and that the Lodz, Lublin,
Kuyavian–Pomeranian, and Holy Cross voivodeships lie outside them (Figure 3).
FIGURE 3
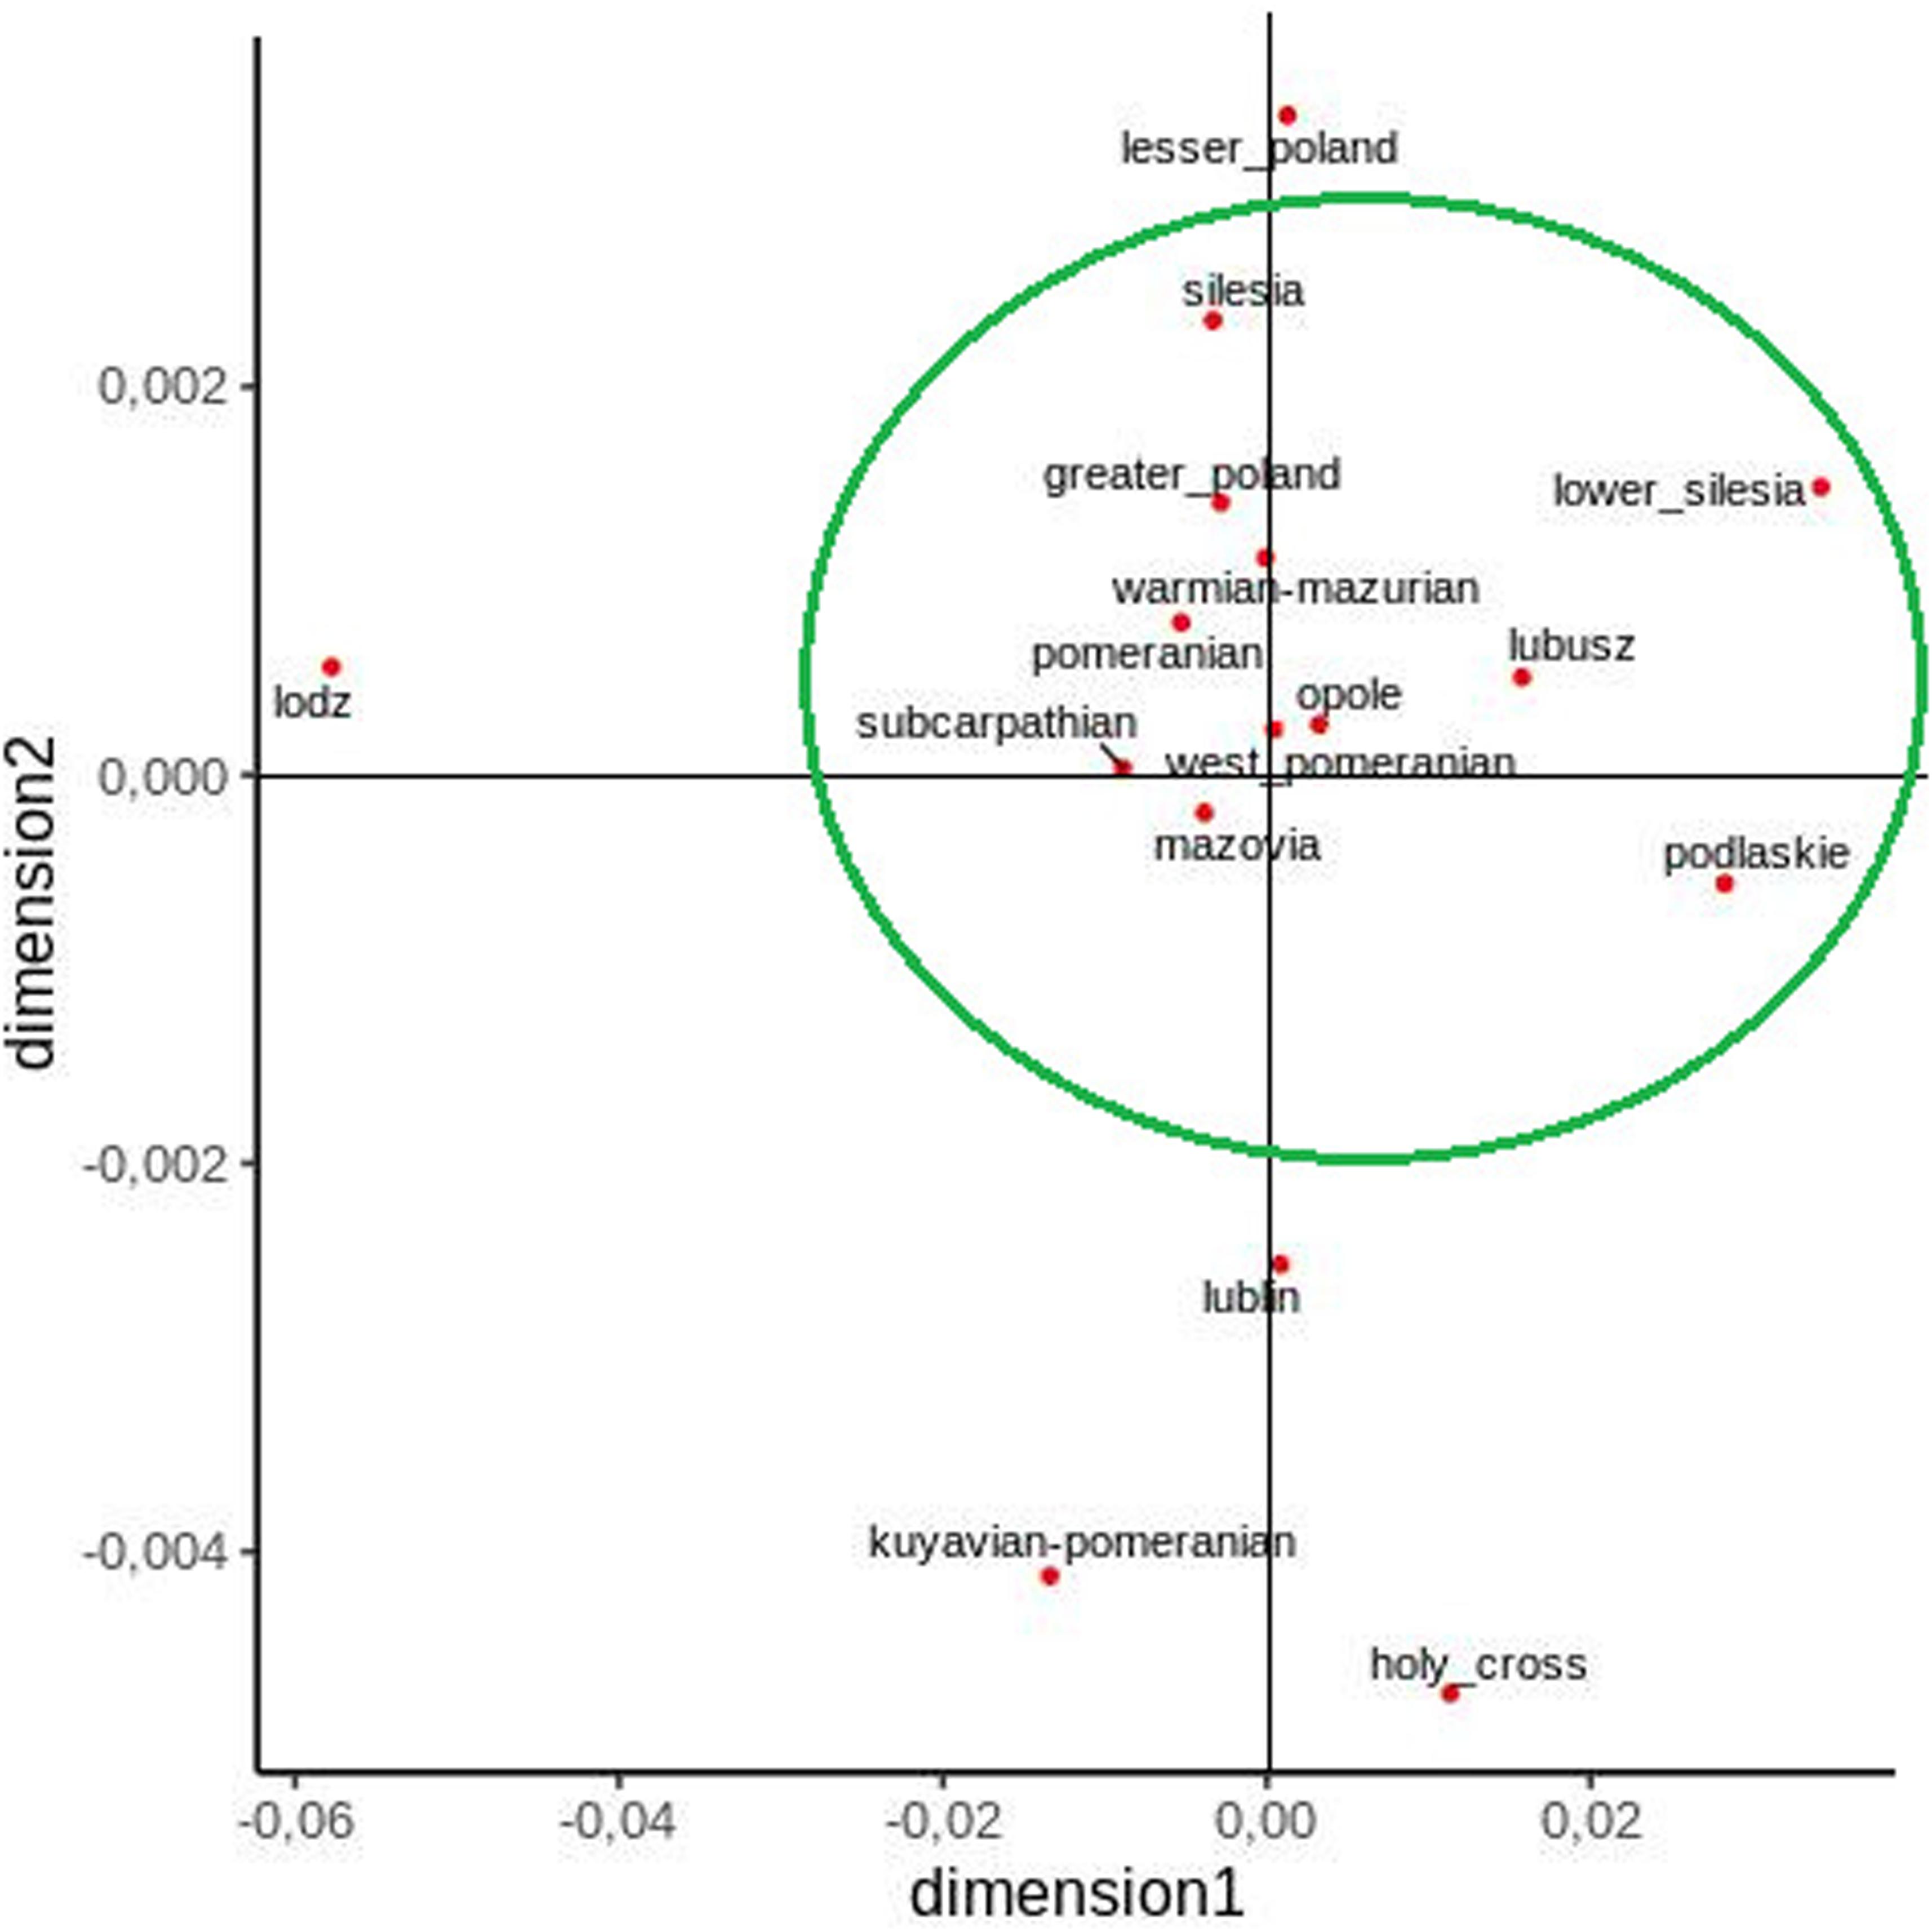
Figure 3. Two-dimensional MDS plot
of Polish voivodeship populations based on pairwise FST values.
The paired FST analysis performed for
clusters returned values ranging from −0.018 to 0.192 (Supplementary Table S5). The highest FST estimates were
identified between clusters 20(Lower Silesia—area of Jelenia G ra
and Zgorzelec) and 30 (Warmian–Mazurian—area of Giżycko,
Ełk, Gołdap) (FST = 0.10778, p =
0.01562); between clusters 20 and 32 (Greater
Poland—Konin, Kalisz, and Sieradz counties) (FST = 0.10776; p =
0.00098), and between 20and 28 (a cluster on the
border of Silesia, Lodz, and Opole) (FST = 0.10692; p =
0.00488) (Supplementary Figure S5 and Supplementary Table S5). Interestingly,
clusters 20 and 12(Subcarpathian region including
Przemyśl, Sanok, and the Bieszczady mountains) demonstrated the same
relations with clusters 30, 28, and 32 (FST = 0.09196; FST = 0.09144;FST = 0.09085,
respectively p = 0.01074; p = 0.00781; p =
0.00293). In addition, 20 and 12did not demonstrate
significant differences in the number of estimates, despite being located on
opposite sides of the country: 20 is in the southwest of
Poland, close to the border with Germany, whereas 12 is found
in the southeast, close to the border with Ukraine. Additionally, the highest
number of statistically significant pairwise FST estimates was observed
in clusters 20 (18 estimates) and 32 (17
estimates) (Supplementary Table S5).
Another MDS plot
was constructed to visualize the relationships between generated clusters (Figure 4). In this case, a large group
was formed including almost all clusters apart from the following: 12 (Bieszczady
region), 14 (region of Słupsk), 20 (region
of Jelenia Góra, Bolesławiec, and Zgorzelec), 28 (region
of Wieluń, Częstochowa, and Lubliniec), 30 (Mazury
region), 32 (region of Konin, Kalisz, and Ostrów
Wielkopolski), and 35 (region of Włocławek
and Kutno) (Figure 4).
FIGURE 4
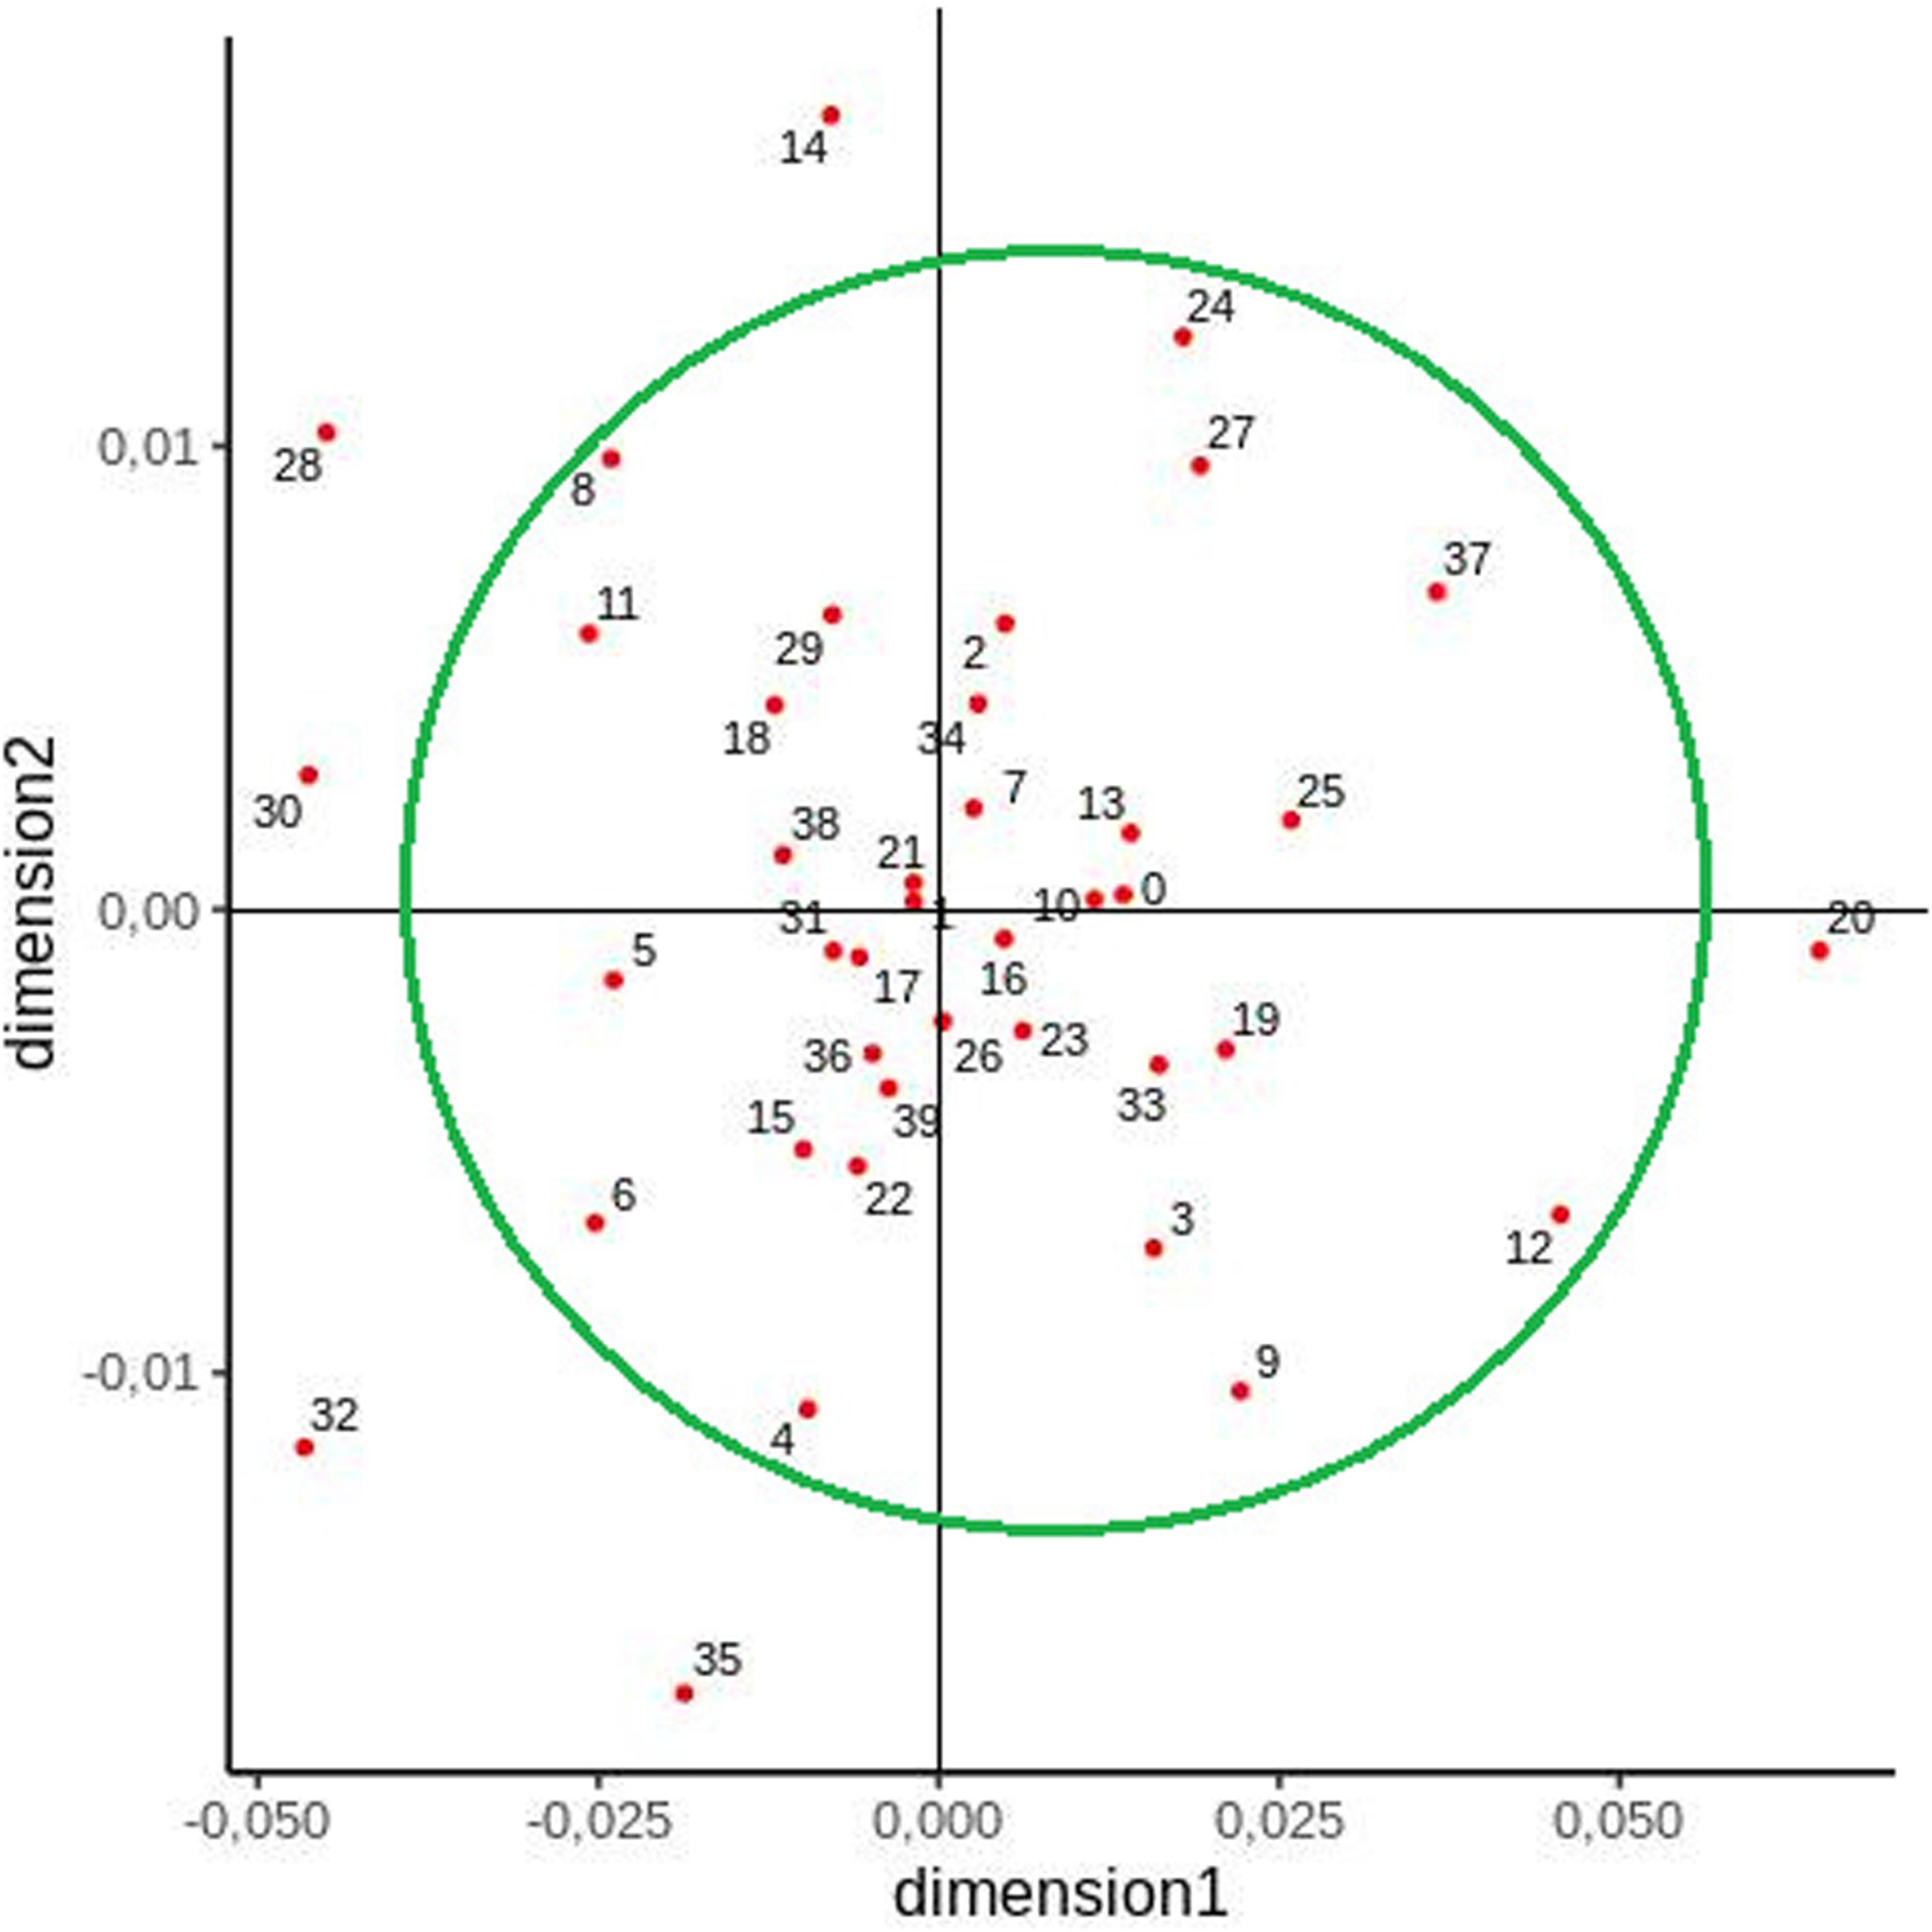
Figure 4. Two-dimensional MDS plot
of cluster populations based on pairwise FSTvalues.
Analysis of Molecular Variance
Analysis of
molecular variance analysis found that, for voivodeships, 99.25% of the
variation was within the population and 0.75% among populations. Similar
results were observed for the clusters: 98.73% of variation was within the
population and 1.27% among populations. The Fixation Index was found to be
0.00746 for the voivodeships and 0.01269 for the clusters, with p =
0.00426, p = 0.01119, respectively (Table 2).
TABLE 2
![]()
Table 2. Analysis of molecular
variance (AMOVA) accounting for all voivodeships and clusters.
The genetic
variability of the Y chromosome across the Polish population has been analyzed
over the years, in studies in regard to different regions of Poland (Pepinski et al., 2001; Janica et al., 2005; Rebala and Szczerkowska, 2005; Soltyszewski et al., 2007; Wozniak et al., 2007;Wolanska-Nowak et al., 2009; Kostrzewa et al., 2013), among Lithuanian,
Byelorussian, and Tatar minorities living in Poland (Pepinski et al., 2004c, 2005a; Janica et al., 2005) and in studies of larger
population groups, including the entire population of the country (Lessig et al., 2001; Ploski et al., 2002; Kayser et al., 2005; Lessig et al., 2008; Soltyszewski et al., 2008;Rebala et al., 2013). Most of these studies were
based on the PCR analysis of STRs. In contrast, the present study was performed
using a microarray approach, which allowed the identification of several SNP on
the Y chromosome; this approach yielded a detailed description of the genetic
structure of the male population in Poland according to its voivodeships and
counties and their clusters.
Haplogroup
prediction was performed based on 496 SNP markers included in the Infinium HTS
Human Core Exome microarray. Because the panel does not allow for
differentiation of all possible haplogroups within the Eurasian metapopulation,
only main haplogroups were considered for calculation of frequencies within
specific voivodeships.
Interpopulation Variability of
Y Chromosome
For the sake of
interpopulation analysis (including haplogroup frequencies from Slovakia,
Slovenia, Czechia, Ukraine, Russia, Lithuania, Latvia, and Germany), we decided
to use our results at the level that would allow for comparison with each
country. The approach of different level of haplogroup estimation chosen for
different types of analysis was also successfully applied by Altena et al. (2020).
Our results
showed to be highly consistent with those obtained by Kayser et al. (2005), performed on a group of 913
Polish males. The frequency of R1a1∗ was almost exactly equal
within both studies [57% in Kayser et al. (2005) and 56.93% in our
sample]. Similarly, frequencies of haplogroups I∗ and R1b∗ were also comparable for
both datasets (17.3 vs. 15.71 and 11.6 vs. 14.09% for hgs I and R1b,
respectively). Because of lack of markers for hgs E3b∗(M35) and N3∗ (M46) within the
microarray used in the hereby presented study, we were not able to calculate
exact frequencies of those hgs. Both of those are, however, subhaplogroups of
hgs included in our results. It can be assumed that at least some part of hg E
(3.84%) belongs to either E3b∗ (M35) [4.5% (Kayser et al., 2005)] or DE∗ (xE3b) (YAP) [0.5% (Kayser et al., 2005)], whereas the frequency of
hg N (4.29%) is most probably a sum of N3∗ (M46) [3.7% (Kayser et al., 2005)] and K∗ (xN3, P) (M9) [0.5% (Kayser et al., 2005)]. The results’ concordance
applies also to haplogroups with lower frequencies for the Polish population:
J2∗(M172) [2.5% (Kayser et al., 2005)] was predicted for 2.37% of
samples, F∗ (xI, J2, K) (M89) [2.0%
(Kayser et al., 2005)]—for 2.11% of the
population, and P∗ (xR1a) (M74) [0.3% (Kayser et al., 2005)] for 0.26% of the
population.
As an insight
into the most recent Polish population, we performed a haplogroup prediction
based on 496 27-Y-STR haplotypes published in 2017 by Spolnicka et al. (2017). A high level of similarity
between both datasets is visible; however, lack of prediction for 140 samples
(>25% of the studied sample set) seems to be the main reason for the
inconsistencies found. One of those is the overrepresentation of haplogroup R1a
[56.93 vs. 68.6%—haplogroup prediction based on Spolnicka et al. (2017)] and the remaining—the
underrepresentation of hg I [15.71 vs. 6.8%—haplogroup prediction based
on Spolnicka et al. (2017)]. The frequencies of some of
the remaining haplogroups predicted (R1b, N, G, Q) are consistent with our
findings. This bias clearly shows the necessity of using the biallelic markers
for the purpose Y-chromosomal haplogroup determination.
While a part of
both the Central and Eastern Europe and Baltic Rim Countries, Poland does vary
from its neighboring countries in terms of the Y-chromosomal haplogroup
structure at least at some level (for details, see Supplementary Table S6 with all national
frequency data discussed below included). Results obtained in the hereby
presented study are shown to be similar to the haplogroup frequencies of
Slovenia (Zupan et al., 2013)—an Eastern Slavic country,
and two countries considered as Western Slavic (Wozniak et al., 2010): the Czechia
(Zastera et al., 2010) and Slovakia (Petrejcikova et al., 2010). The populations of those
countries are considered homogenous (Rebala et al., 2007). This is especially the case
for Poland and Czechia, as confirmed by the PCA of autosomal biallelic markers
studied by Lao et al. (2008). In our case, the main
difference between Slovenia, Czechia, Slovakia, and Poland laid in the
frequency of hg R1a, found in almost 57% Polish males, whereas only between
36.9% (Slovenia) and 38% (Slovakia) for the aforementioned nations. Both
Slovenia and Czechia are also characterized by a much higher level of hg R1b
(20.3 and 24.8%, respectively), whereas for Slovakia the level of R1b seems
similar to that of Poland (13.2 vs. 14.09%, respectively). Both Slovenians and
Slovakians often fall within hg I (28.3 and 27.2%, respectively). Hg I is also
frequently found in Czechia (20.1%), whereas in our results obtained for Poland
its frequency is established at 15.7%. Hgs with lower frequencies, contributing
to 12.57% of the Polish population (J, G, E, and N), are also found within all
three of the aforementioned countries, the only exception being haplogroup N,
not present in the Slovenian population. Those haplogroups sum up to 12.2,
17.2, and 17.4% of Slovenian, Slovakian, and Czechia populations, respectively.
The populations
of Lithuania (Kasperaviciute et al., 2004) and Latvia (Pliss et al., 2015) seem genetically more
distant from Poland, regardless of the Polish-Lithuanian Union that lasted for
more than 400 years between the XIV and XVIII century (Ploski et al., 2002). In both of those countries, hg N is one of the two
most commonly found haplogroups (36.7 and 41.5%, respectively), present only in
4.29% of Polish population, with the other most frequent hg being R1a (44.9 and
37.8%, respectively). R1a is the most common haplogroup in Poland, found in
almost 57% of the population. The Germanic R1b haplogroup is found in Latvia
and Lithuania on a much lower level than in Poland, understandably (Wozniak et al., 2010). For Lithuania its frequency
is estimated to be below 5.1% [as (Kasperaviciute et al., 2004) did not differentiate
between R1b and Q, this is the sum of both] and for Latvia—7.6%, which is
almost three and two times less than what can be found in Poland, respectively.
As Maliarczuk and Derenko (2008) investigated levels of haplogroup frequencies through the European part of Russia,
some conclusions can be drawn regarding their similarity and differences to the
population of Poland, also in comparison to the in-between Ukraine (Mielnik-Sikorska et al., 2013b). For both Russia and
Ukraine, hg R1a is still common [Northern Russia (NR)—34.2%, CR (Central
Russia)—46.54%, South Russia (SR)—55.4%, Ukraine—43.9%]; however, in NR, hg N
is the most frequent one (43% of the population). For CR and SR, the value of
haplogroup N frequency is lower (17.2 and 10%, respectively), yet much higher
than for Poland (4.29%). Haplogroup N was not found by Mielnik-Sikorska et al. (2013b) within the Ukrainian population.
Similarly to Lithuania and Latvia, both Russia and Ukraine are much lower in
R1b subhaplogroup than Poland (Ukraine and NR—5.4%, CR—7.1%, SR—4,8%).
Haplogroup I is found with a high frequency in Ukraine and SR (28.4 and 21%,
respectively) and CR and NR (17.5 and 13.1%, respectively), unlike in Poland,
where we calculated it can be found in greater than 6% of the population. In
all of the aforementioned countries, haplogroup J is found in less than 5% of
the population (Ukraine—3.4%, NR—1.8%, CR—4.0%, SR—3.5%), much like in Poland
(3.22%). Furthermore, it is the J2 subhaplogroup that is found more frequently,
including Ukraine, where J2 is found almost exclusively.
As expected,
from all of the neighboring countries, Germany is the one most distant from
Poland in Y-haplogroup distribution. As observed by Kayser et al. (2005), the frequency of R1b is
almost three times higher for Germany than for Poland (38.9 vs. 14.09%), the
frequency of I—almost four times (23.6 vs. 6.02%), whereas R1a is found almost
three times less frequently in Germany than in Poland (17.9 vs. 56.93%,
respectively).
Intrapopulation Variability of
Y Chromosome
Y-chromosome
polymorphism analysis and both Y-SNP and Y-STR typing indicate that the Polish
population is highly homogeneous both in terms of the entire country (Ploski et al., 2002) and separate regions (Pepinski et al., 2004a; Soltyszewski et al., 2007; Wozniak et al., 2007; Wolanska-Nowak et al., 2009). While the present study
generally confirmed this result, it also allowed a more detailed insight at the
diversity of the Polish population at the level of administrative units and
clustered regions: the genetic information was related to place of residence,
with participants from all voivodeships and the majority of counties; further
testing was also facilitated by the use of clustering as an additional method
of population grouping. A goal of the study was to see if a different result
could be achieved by using a large set of data; examining a well-established
representation of the entire Polish population and the use of regional
clustering, we will get different result. Our findings indicate homogeneity
with most variation occurring within populations at the voivodeship and cluster
level: 99.25% for voivodeships and 98.73% for clusters. Only a small proportion
of total variance was attributed to variation among groups in voivodeships
(0.75%) and clusters (1.27%). This observation is consistent with Kayser et al. (2005), who reported 0.3%
variability computed for Y chromosome SNPs.
The observed
differences between the studies can be accounted for by differences in sample
population number and profile. The present study was based on a data set
comprising 2,705 individuals from all 16 voivodeships and 337 of the 380
counties, whereas the results ofKayser et al. (2005) were
probably based on inhabitants of the selected cities in Poland (Wrocław,
Warsaw, Lublin, Kraków, Bydgoszcz, Gdańsk, Szczecin, and Suwałki).
Unfortunately, because of a lack of such studies, it is not possible to perform
a detailed comparison of haplogroup frequencies for all voivodeships and
counties.
Regarding the
numbers of different haplogroups in voivodeships, the present findings
correspond with the variability of mtDNA in the Polish population (Jarczak et al., 2019). In the earlier study, the
Silesia voivodeship was indicated as the region with the greatest number of
mtDNA haplogroups (19 of 21). A similar situation is observed in the present
study: 10 of 11 total Y-chromosome haplogroups were found in individuals from
Silesia. In contrast, Holy Cross voivodeship demonstrated the least variety,
with only 10 mtDNA haplogroups. The differences shown in the present study are
not so highlighted, with most voivodeships being characterized by six or seven
haplogroups. The distribution and the frequency of haplogroups indicate that
the Polish population is characterized by greater diversity in the case of mtDNA (Jarczak et al., 2019); several haplogroups
were found to be present in the Polish population, with hg H demonstrating the
highest frequency. Furthermore, four hgs (H, U, J, T) accounted for 82.38% of
the studied population; however, many others prevalent in the European
population (K, W, I, HV, V) were also observed. The Y-chromosome SNP analysis
found R to be present in more than 71% of Polish males and, together with hg I,
represents the vast majority of Y chromosome haplogroups (86.73%).
In contrast to
previous studies, the present study examined a larger number of samples taken
from individuals from all administrative regions of Poland and applied
clustering as an additional method of grouping the populations. However, slight
differences were observed between some studied regions according to the method
of analysis. The Lodz voivodeship, for example, was found to be distinct from
other voivodeships with regard to mtDNA variability (Jarczak et al., 2019). The historical basis for
this variation is unclear: in contrast to West Pomerania and Warmia–Mazuria,
Łódź, as a native voivodeship (excluding west part—see below), has
not been the site of large-scale migration. Furthermore, MDS visualization
indicated that almost all clusters were grouped together, indicating population
homogeneity; however, clusters 12 (Bieszczady region), 14 (Słupsk
region), 20 (Jelenia Góra, Bolesławiec, and Zgorzelec
region), 28 (Wieluń, Częstochowa, and Lubliniec
region), 30 (Mazury region),32 (Konin, Kalisz, and
Ostrów Wielkopolski region), and 35 (Włocławek and
Kutno region) were distinct from this grouping, suggesting that genetic
differences exist between their inhabitants.
The Bieszczady
region, for example, is located in the southeastern part of Poland and is
considered geographically distant from the rest of the country. It is
characterized by one of the highest levels of forest cover in Poland and a lack
of large urban centers. Furthermore, the region was historically affected by
mass displacement of Lemkos and Ukrainians, with about 700,000 people having
been displaced from the former Rzeszów voivodeship, particularly the counties
of Lesko, Przemyśl, and Sanok: the Ukrainian people were moved to the
east, whereas the Lemkos mainly settled the Lower Silesia and Masuria, which
were granted to Poland after WWII. The Bieszczady region itself was resettled
from the late 1950s (Ociepka, 2001).
Cluster 30,
which corresponds to the Mazury region, has a different history to Bieszczady
but was also a site of mass resettlement. Before the WWII, the region was part
of German East Prussia; however, from 1946 to the 1970s, the Masurians
inhabitants migrated to Germany and were replaced by people from other regions
of Poland, such as those resettled from the Bieszczady region.
In the case of
clusters 20, 28, 30, and 32,
however, the historical explanation for their separation based on demographic
processes is unclear. There are some historical justifications, such as the
complete removal of at least 250,000 native Polish citizens, and their
replacement by German citizens mostly from the Baltic region, i.e., the Reich District
Land of the Warta river (Ger. Der Reichsgau Wartheland) (Eberhardt, 2000). The Warta river land
covered a vast area from Poznań in the west, through the Kalisz region to
Lodz in the east, and reaching as far as Inowrocław in the north, which
more or less corresponds to the areas covered by cluster no. 32.
Interestingly,
while previous analyses based on mtDNA variability (Jarczak et al., 2019) generally identify different
regions as being genetically distinct, some similarities between the studies
are visible. The region of Western Kuyavia (cluster no. 47 in the cited study)
seems to be comparable to cluster 32, at least in some counties, in
that it was also found to be genetically distinct. In addition, the previous
study based on mtDNA variation indicated the Mazuria region (cluster no. 49 in
the cited study) to be genetically distinct, and the present study found its
analogous cluster to be the same (no. 30). However, it is not
possible to make a full and accurate comparison between the two studies because
of different number of clusters.
The
interpolation maps were used to visualize regional differences between observed
frequencies of hgs in Poland. As shown in Figure 1, haplogroup
R1a is distributed mostly in the center part of Poland with a few regions on
the west and east of the country. Interestingly, R1a was also found to be
present in high numbers in eastern regions, including the Podlaskie and
Warmian–Mazurian voivodeships, as well as almost all of the Lublin voivodeship;
similar results were also obtained from central regions and Western Pomerania,
which may have some historical basis. In contrast, R1b was more widely
distributed, reaching farther east and west than the others; however, it is
observed at relatively low frequencies in regions adjacent to the western and
eastern borders of Poland. Such a pattern of distribution of hg R in the Polish
population can reflect some historical events such as massive human migrations
or the changes in the territorial borders.
A similar
situation was observed in the case of hg I, whose distribution also followed
geographic lines and possibly historical events. Haplogroup I is found to be
represented mostly in western Poland and some region of eastern Poland, mostly
in the Podlaskie and Lublin voivodeships, but also reaches the eastern parts of
Mazovia, the western parts of Warmian–Mazurian, and almost all of Subcarpathia,
which makes these regions similar to the west in terms of haplogroup frequency.
Interestingly,
in the case of hg N, the Podlaskie voivodeship is distinct from the remaining
voivodeships: as it was mentioned above, the frequency of hg N, which is common
among the populations of Lithuania (Kasperaviciute et al., 2004) and Latvia (Pliss et al., 2015) and other inhabitants of northeast Europe, is 14.55%
in this area and brings Podlaskie closer to the northern regions in this
regard. In contrast, hg E displays much greater homogeneity across the map,
with fewer marked differences between regions.
The
comprehensive analysis of Y-chromosome variability described in the present
study, i.e., based on the data from 2,705 individuals, including those from all
voivodeships and most counties, and employing clustering as an additional
method of population grouping, is the first of its type to be performed on the
population of Poland. The findings confirm that the Polish population is
characterized by a high degree of homogeneity, with only slight genetic
differences being observed at the regional level. The use of regional
clustering as an alternative to counties and voivodeships provided a more
detailed view of the genetic structure of the population; the cluster analysis
also identified any misleading differences observed between voivodeships.
Such a broad
genetic analysis of Polish population should be able to give insights into the
history of different regions of the country, especially given the individuals
studied were asked to include information concerning their ancestry. The
quality of answers given was, however, less than satisfactory, and so no
conclusions can be drawn, because the history of the paternal line of those
people remains unknown. It seems the only way to pursue the search for local
history is to study populations with regard to even three-generations-down
worth of genealogy knowledge, as shown by Rebala et al. (2013).
The results of
the present study, together with previously published data about mtDNA
variability, could serve as the basis for the further research into the
connection between the modern and ancient times of Poland with regard to human
migration and resettlement, as well as historical and cultural influences.
Furthermore, regional differences identified by the mtDNA variability study and
the present one highlight the need for additional division of the population by
cultural and ethnic criteria in such studies rather than just by geographical
or administrative regionalization. Representatives of ethnic (Karaites,
Tatars), cultural (Kashubians, Kurpie, Podhale highlanders), and indigenous
groups in specific regions of Poland should be included in future analyses.
The datasets
presented in this study can be found in online repositories. The names of the
repository/repositories and accession number(s) can be found below: https://ega-archive.org/studies/EGAS00001004111.
The studies
involving human participants were reviewed and approved by University of Lodz
Ethics Review Board. The patients/participants provided their written informed
consent to participate in this study.
DS
conceptualized and supervised the study, provided the funding, organized and
integrated the data. BM provided the funding, organized and integrated the
data. ŁG, JJ, and MU performed bioinformatic analyses. MS-K and MSł
performed microarray analysis. DS, JJ, WL, ŁG, PB, MSł, MS-K, MU,
MSz, and AO analyzed the result of differences in haplogroups frequencies
within Polish population. JJ, MSł, ŁG, WL, PB, AO, MSz, and DS
drafted the manuscript. All authors contributed to the article and approved the
submitted version.
The study was
financed by Polish Ministry of Science and Higher Education no. DIR/WK/2017/01:
“Biobank network in Poland, within the BBMRI-ERIC Research Infrastructure of
Biobanks and Biomolecular Resources” and POPC.02.03.01-00-0012/17: “Digital
sharing of biomolecular and descriptive resources of Biobank and Department of
Anthropology, University of Lodz – characteristics of populations living in
present-day Poland through the ages. Information platform e-Czlowiek.pl”
(Operational Programme Digital Poland for 2014–2020). POPULOUS collection was
financed by the Polish POIG Grant 01.01.02-10-005/08 TESTOPLEK from the
European Regional Development Fund.
The authors
declare that the research was conducted in the absence of any commercial or
financial relationships that could be construed as a potential conflict of
interest.
The
Supplementary Material for this article can be found online at:https://www.frontiersin.org/articles/10.3389/fgene.2020.567309/full#supplementary-material
Altena, E., Smeding, R., van der Gaag, K. J., Larmuseau, M. H. D., Decorte,
R., Lao, O., et al. (2020). The Dutch Y-chromosomal landscape. Eur. J.
Hum. Genet. 28, 287–299. doi: 10.1038/s41431-019-0496-0
PubMed
Abstract | CrossRef Full Text | Google Scholar
Behar, D. M., Metspalu, M., Baran, Y., Kopelman, N. M., Yunusbayev, B.,
Gladstein, A., et al. (2013). No evidence from genome-wide data of a Khazar
origin for the Ashkenazi Jews. Hum. Biol. 85, 859–900. doi:
10.3378/027.085.0604
PubMed
Abstract | CrossRef Full Text | Google Scholar
Branicki, W., Kalista, K., Kupiec, T., Wolanska-Nowak, P., Zoledziewska,
M., and Lessig, R. (2005). Distribution of mtDNA haplogroups in a population
sample from Poland. J. Forensic Sci. 50, 732–733.
Czerniakiewicz, J. (1987). Repatriacja Ludności Polskiej z
ZSRR 1944-1948. Warsaw: PWN.
Diepenbroek, M., Cytacka, S., Szargut, M., Arciszewska, J., Zielinska, G.,
and Ossowski, A. (2019). Analysis of male specific region of the human Y
chromosome sheds light on historical events in Nazi occupied eastern
Poland. Int. J. Legal Med. 133, 395–409. doi:
10.1007/s00414-018-1943-0
PubMed
Abstract | CrossRef Full Text | Google Scholar
Dobrowolska, S., Michalska-Madej, J., Słomka, M., Sobalska-Kwapis, M.,
and Strapagiel, D. (2019). Biobank Łoìdzì® - population based
biobank at the University of Łoìdzì, Poland. Eur. J. Transl. Clin. Med. 2, 85–95. doi:
10.31373/ejtcm/109495
CrossRef
Full Text | Google Scholar
Eberhardt, P. (2000). Population
Movements on the Territory of Poland Caused by the World War II. Warsaw:
IGiPZ PAN.
Excoffier, L., and Lischer,
H. E. (2010). Arlequin suite ver
3.5: a new series of programs to perform population genetics analyses under
Linux and Windows. Mol. Ecol. Resour. 10,
564–567. doi: 10.1111/j.1755-0998.2010.02847.x
PubMed
Abstract | CrossRef Full Text | Google Scholar*
Data Availability Statement
The datasets presented
in this study can be found in online repositories. The names of the
repository/repositories and accession number(s) can be found below: https://ega-archive.org/studies/EGAS00001004111.
Ethics Statement
The studies involving
human participants were reviewed and approved by University of Lodz Ethics
Review Board. The patients/participants provided their written informed consent
to participate in this study.
Author Contributions
DS conceptualized and
supervised the study, provided the funding, organized and integrated the data.
BM provided the funding, organized and integrated the data. ŁG, JJ, and MU
performed bioinformatic analyses. MS-K and MSł performed microarray
analysis. DS, JJ, WL, ŁG, PB, MSł, MS-K, MU, MSz, and AO analyzed the
result of differences in haplogroups frequencies within Polish population. JJ,
MSł, ŁG, WL, PB, AO, MSz, and DS drafted the manuscript. All authors
contributed to the article and approved the submitted version.
Funding
The study was financed
by Polish Ministry of Science and Higher Education no. DIR/WK/2017/01: “Biobank
network in Poland, within the BBMRI-ERIC Research Infrastructure of Biobanks
and Biomolecular Resources” and POPC.02.03.01-00-0012/17: “Digital sharing of
biomolecular and descriptive resources of Biobank and Department of
Anthropology, University of Lodz – characteristics of populations living in
present-day Poland through the ages. Information platform e-Czlowiek.pl”
(Operational Programme Digital Poland for 2014–2020). POPULOUS collection was
financed by the Polish POIG Grant 01.01.02-10-005/08 TESTOPLEK from the
European Regional Development Fund.
Conflict of Interest
The authors declare
that the research was conducted in the absence of any commercial or financial
relationships that could be construed as a potential conflict of interest.
Supplementary Material
The Supplementary
Material for this article can be found online at:https://www.frontiersin.org/articles/10.3389/fgene.2020.567309/full#supplementary-material
References
Altena, E., Smeding,
R., van der Gaag, K. J., Larmuseau, M. H. D., Decorte, R., Lao, O., et al.
(2020). The Dutch Y-chromosomal landscape. Eur. J. Hum. Genet. 28, 287–299. doi:
10.1038/s41431-019-0496-0
PubMed Abstract | CrossRef Full Text | Google Scholar
Behar, D. M.,
Metspalu, M., Baran, Y., Kopelman, N. M., Yunusbayev, B., Gladstein, A., et al.
(2013). No evidence from genome-wide data of a Khazar origin for the Ashkenazi
Jews. Hum. Biol. 85,
859–900. doi: 10.3378/027.085.0604
PubMed Abstract | CrossRef Full Text | Google Scholar
Branicki, W., Kalista,
K., Kupiec, T., Wolanska-Nowak, P., Zoledziewska, M., and Lessig, R. (2005).
Distribution of mtDNA haplogroups in a population sample from Poland. J. Forensic Sci. 50,
732–733.
Czerniakiewicz, J.
(1987). Repatriacja Ludności Polskiej z ZSRR 1944-1948. Warsaw: PWN.
Diepenbroek, M.,
Cytacka, S., Szargut, M., Arciszewska, J., Zielinska, G., and Ossowski, A.
(2019). Analysis of male specific region of the human Y chromosome sheds light
on historical events in Nazi occupied eastern Poland. Int. J. Legal Med. 133, 395–409. doi:
10.1007/s00414-018-1943-0
PubMed Abstract | CrossRef Full Text | Google Scholar
Dobrowolska, S.,
Michalska-Madej, J., Słomka, M., Sobalska-Kwapis, M., and Strapagiel, D.
(2019). Biobank Łoìdzì® - population based biobank at the University of
Łoìdzì, Poland. Eur. J. Transl. Clin.
Med. 2, 85–95. doi:
10.31373/ejtcm/109495
CrossRef Full Text | Google Scholar
Eberhardt, P. (2000). Population Movements on the Territory of Poland Caused
by the World War II. Warsaw:
IGiPZ PAN.
Excoffier, L., and
Lischer, H. E. (2010). Arlequin suite ver 3.5: a new series of programs to
perform population genetics analyses under Linux and Windows. Mol. Ecol. Resour. 10, 564–567. doi:
10.1111/j.1755-0998.2010.02847.x
PubMed Abstract | CrossRef Full Text | Google Scholar
Gill,
P., Brenner, C., Brinkmann, B., Budowle, B., Carracedo, A., Jobling, M. A., et
al. (2001). DNA commission of the international society of forensic genetics:
recommendations on forensic analysis using Y-chromosome STRs. Forensic Sci. Int. 124, 5–10. doi:
10.1016/s0379-0738(01)00498-4
CrossRef Full Text | Google Scholar
Grzybowski,
T., Malyarchuk, B. A., Derenko, M. V., Perkova, M. A., Bednarek, J., and
Wozniak, M. (2007). Complex interactions of the Eastern and Western slavic
populations with other European groups as revealed by mitochondrial DNA
analysis. Forensic Sci. Int. Genet. 1, 141–147. doi:
10.1016/j.fsigen.2007.01.010
PubMed Abstract | CrossRef Full Text | Google Scholar
Hryciuk,
G., Ruchniewicz, M., Szaynok, B., and żbikowski, A. (2008). Wysiedlenia, Wypêdzenia i Ucieczki 1939-1959: Atlas
Ziem Polski. Warsaw: Demart
SA.
Janica,
J., Pepinski, W., Niemcunowicz-Janica, A., Skawronska, M.,
Aleksandrowicz-Bukin, M., Ptaszynska-Sarosiek, I., et al. (2005). Y-chromosome
STR haplotypes and alleles in the ethnic group of Polish Tatars residing in the
Northeastern Poland. Forensic Sci. Int. 150, 91–95. doi:
10.1016/j.forsciint.2004.08.012
CrossRef Full Text | Google Scholar
Janica,
J., Pepinski, W., Niemcunowicz-Janica, A., Skawronska, M., Soltyszewski, I.,
and Berent, J. (2008). Ethnic variation and forensic usefulness of Y-STR loci
in inhabitants of northeastern Poland. Arch. Med. Sadowej
Kryminol. 58, 17–21.
Janica,
J., Pepinski, W., Skawronska, M., Niemcunowicz-Janica, A., Koc-Zurawska, E.,
and Soltyszewski, I. (2006). Polymorphism of four X-chromosomal STRs in a
population sample of Belarusian minority residing in Podlasie (NE poland). Arch. Med. Sadowej Kryminol. 56, 232–235.
Jarczak,
J., Grochowalski, L., Marciniak, B., Lach, J., Slomka, M., Sobalska-Kwapis, M.,
et al. (2019). Mitochondrial DNA variability of the Polish population. Eur. J. Hum. Genet. 27, 1304–1314. doi:
10.1038/s41431-019-0381-x
PubMed Abstract | CrossRef Full Text | Google Scholar
Juras,
A., Dabert, M., Kushniarevich, A., Malmstrom, H., Raghavan, M., Kosicki, J. Z.,
et al. (2014). Ancient DNA reveals matrilineal continuity in present-day Poland
over the last two millennia. PLoS One 9:e110839. doi:
10.1371/journal.pone.0110839
PubMed Abstract | CrossRef Full Text | Google Scholar
Kasperaviciute,
D., Kucinskas, V., and Stoneking, M. (2004). Y chromosome and mitochondrial DNA
variation in Lithuanians. Ann. Hum. Genet. 68(Pt 5), 438–452. doi:
10.1046/j.1529-8817.2003.00119.x
CrossRef Full Text | Google Scholar
Kayser,
M., Lao, O., Anslinger, K., Augustin, C., Bargel, G., Edelmann, J., et al.
(2005). Significant genetic differentiation between Poland and Germany follows
present-day political borders, as revealed by Y-chromosome analysis. Hum. Genet.117, 428–443. doi:
10.1007/s00439-005-1333-9
CrossRef Full Text | Google Scholar
Kersten,
K. (1974). Repatriacja Ludności Polskiej po II Wojnie
światowej (Studium Historyczne). Wrocław: Zakład Narodowy
im. Ossolińskich.
Kosiński,
L. (1960). Pochodzenie Terytorialne Ludności Ziem Zachodnich
w 1950. Warsaw: IGiZP.
Kostrzewa,
G., Broda, G., Konarzewska, M., Krajewki, P., and Ploski, R. (2013). Genetic
polymorphism of human Y chromosome and risk factors for cardiovascular
diseases: a study in WOBASZ cohort. PLoS One 8:e68155. doi:
10.1371/journal.pone.0068155
PubMed Abstract | CrossRef Full Text | Google Scholar
Lao,
O., Lu, T. T., Nothnagel, M., Junge, O., Freitag-Wolf, S., Caliebe, A., et al.
(2008). Correlation between genetic and geographic structure in Europe. Curr. Biol. 18,
1241–1248. doi: 10.1016/j.cub.2008.07.049
PubMed Abstract | CrossRef Full Text | Google Scholar
Latuch,
M. (1994). Repatriacja Ludności Polskiej w Latach 1955-1960
na tle Zewnêtrznych Ruchów Wêdrówkowych.Warsaw: PTD.
Lessig,
R., Edelmann, J., and Krawczak, M. (2001). Population genetics of Y-chromosomal
microsatellites in Baltic males. Forensic Sci. Int. 118, 153–157. doi:
10.1016/s0379-0738(01)00384-x
CrossRef Full Text | Google Scholar
Lessig,
R., Edelmann, J., Thiele, K., Kozhemyako, V., Jonkisz, A., and Dobosz, T.
(2008). Results of Y-SNP typing in three different populations. Forensic Sci. Intern. Genet. Suppl. Ser. 1, 219–221. doi: 10.1016/j.fsigss.2007.10.122
CrossRef Full Text | Google Scholar
Maliarczuk,
B. A., and Derenko, M. (2008). Gene pool structure of Russian populations from
the European part of Russia inferred from the data on Y chromosome haplogroups
distribution. Genetika 44, 226–231.
Malyarchuk,
B., Grzybowski, T., Derenko, M., Perkova, M., Vanecek, T., Lazur, J., et al.
(2008). Mitochondrial DNA phylogeny in Eastern and Western Slavs. Mol. Biol. Evol. 25,
1651–1658. doi: 10.1093/molbev/msn114
PubMed Abstract | CrossRef Full Text | Google Scholar
Malyarchuk,
B. A., Rogozin, I. B., Berikov, V. B., and Derenko, M. V. (2002). Analysis of
phylogenetically reconstructed mutational spectra in human mitochondrial DNA
control region. Hum. Genet. 111, 46–53. doi:
10.1007/s00439-002-0740-4
PubMed Abstract | CrossRef Full Text | Google Scholar
Mielnik-Sikorska,
M., Daca, P., Malyarchuk, B., Derenko, M., Skonieczna, K., Perkova, M., et al.
(2013a). The history of Slavs inferred from complete mitochondrial genome
sequences. PLoS One 8:e54360.
doi: 10.1371/journal.pone.0054360
PubMed Abstract | CrossRef Full Text | Google Scholar
Mielnik-Sikorska,
M., Daca, P., Wozniak, M., Malyarchuk, B. A., Bednarek, J., Dobosz, T., et al.
(2013b). Genetic data from Y chromosome STR and SNP loci in Ukrainian
population. Forensic Sci. Int. Genet. 7, 200–203. doi:
10.1016/j.fsigen.2012.05.007
PubMed Abstract | CrossRef Full Text | Google Scholar
Ociepka,
B. (2001). Deportacje, Wysiedlenia, Przesiedlenia - Powojenne
Migracje z Polski i do Polski. Poznań:
Instytut Zachodni.
Pedregosa,
F., Varoquaux, G., Gramfort, A., Michel, V., Thirion, B., Grisel, O., et al. (2011). Scikit-learn: machine Learning in Python. J. Mach. Learn. Res. 12, 2825–2830.
Pepinski,
W., Janica, J., Skawronska, M., Niemcunowicz-Janica, A., and Soltyszewski, I.
(2001). Population genetics of 15 STR loci in the population of Podlasie (NE
Poland). Forensic Sci. Int. 124, 226–227. doi:
10.1016/s0379-0738(01)00603-x
CrossRef Full Text | Google Scholar
Pepinski,
W., Niemcunowicz-Janica, A., Ptaszynska-Sarosiek, I., Skawronska, M.,
Koc-Zorawska, E., Janica, J., et al. (2004a). Population genetics of
Y-chromosome STRs in a population of Podlasie, Northeastern Poland. Forensic Sci. Int.144, 77–82. doi:
10.1016/j.forsciint.2004.02.024
CrossRef Full Text | Google Scholar
Pepinski,
W., Niemcunowicz-Janica, A., Skawronska, M., Koc-Zorawska, E., Janica, J., and
Soltyszewski, I. (2004b). Allele distribution of 15 STR loci in a population
sample of Byelorussian minority residing in the northeastern Poland.Forensic Sci. Int. 139, 265–267. doi:
10.1016/j.forsciint.2003.11.013
PubMed Abstract | CrossRef Full Text | Google Scholar
Pepinski,
W., Niemcunowicz-Janica, A., Skawronska, M., Koc-Zorawska, E., Janica, J., and
Soltyszewski, I. (2004c). Allele distribution of 15 STR loci in a population
sample of the Lithuanian minority residing in the Northeastern Poland.Forensic Sci. Int. 144, 65–67. doi:
10.1016/j.forsciint.2004.01.023
PubMed Abstract | CrossRef Full Text | Google Scholar
Pepinski,
W., Niemcunowicz-Janica, A., Skawronska, M., Janica, J., Koc-Zorawska, E.,
Aleksandrowicz-Bukin, M., et al. (2005a). Genetic data on 15 STR loci in the
ethnic group of Polish Tatars residing in the area of Podlasie (Northeastern
Poland). Forensic Sci. Int. 149, 263–265. doi:
10.1016/j.forsciint.2004.07.009
CrossRef Full Text | Google Scholar
Pepinski,
W., Niemcunowicz-Janica, A., Skawronska, M., Janica, J., Koc-Zorawska, E., and
Soltyszewski, I. (2005b). Genetic data on 15 STRs in a population sample of
religious minority of Old believers residing in the northeastern Poland. Forensic Sci. Int. 148, 61–63. doi:
10.1016/j.forsciint.2004.04.010
PubMed Abstract | CrossRef Full Text | Google Scholar
Petrejcikova,
E., Sotak, M., Bernasovska, J., Bernasovsky, I., Sovicova, A., Bozikova, A., et
al. (2010). The genetic structure of the Slovak population revealed by
Y-chromosome polymorphisms. Anthropol. Sci. 118:ase.090203. doi:
10.1537/ase.090203
CrossRef Full Text | Google Scholar
Piesowicz,
K. (1988). Wielkie ruchy migracyjne w latach 1945-1950. Czêśæ I Stud. Demograficzne 4:96.
Pliss,
L., Timsa, L., Rootsi, S., Tambets, K., Pelnena, I., Zole, E., et al. (2015).
Y-chromosomal lineages of latvians in the context of the genetic variation of
the eastern-baltic region. Ann. Hum. Genet. 79, 418–430. doi: 10.1111/ahg.12130
PubMed Abstract | CrossRef Full Text | Google Scholar
Ploski,
R., Wozniak, M., Pawlowski, R., Monies, D. M., Branicki, W., Kupiec, T., et al.
(2002). Homogeneity and distinctiveness of Polish paternal lineages revealed by
Y chromosome microsatellite haplotype analysis. Hum. Genet. 110,
592–600. doi: 10.1007/s00439-002-0728-720
CrossRef Full Text | Google Scholar
Polish
Ministry of Information (1941). Concise Statistical
Year-Book of Poland: September 1939 – June 1941. London: Statistics Poland.
Polish
War Reparations Bureau (1947). Sprawozdanie w
Przedmiocie Strat i Szkód Wojennych Polski w Latach 1939-1945. Warsaw: Polish War Reparations Bureau.
Poznik,
G. D. (2016). Identifying Y-chromosome haplogroups in arbitrarily large samples
of sequenced or genotyped men. bioarXiv [Preprint], doi: 10.1101/088716
CrossRef Full Text | Google Scholar
Rebala,
K., Martinez-Cruz, B., Tonjes, A., Kovacs, P., Stumvoll, M., Lindner, I., et
al. (2013). Contemporary paternal genetic landscape of Polish and German
populations: from early medieval Slavic expansion to post-World War II
resettlements. Eur. J. Hum. Genet. 21, 415–422. doi:
10.1038/ejhg.2012.190
PubMed Abstract | CrossRef Full Text | Google Scholar
Rebala,
K., Mikulich, A. I., Tsybovsky, I. S., Sivakova, D., Dzupinkova, Z.,
Szczerkowska-Dobosz, A., et al. (2007). Y-STR variation among Slavs: evidence
for the Slavic homeland in the middle Dnieper basin. J. Hum. Genet. 52,
406–414. doi: 10.1007/s10038-007-0125-6
PubMed Abstract | CrossRef Full Text | Google Scholar
Rebala,
K., and Szczerkowska, Z. (2004). Identification of a very short YCAII allele in
the northern Polish population.Arch.
Med. Sadowej Kryminol. 54,
17–24.
Rebala,
K., and Szczerkowska, Z. (2005). Polish population study on Y chromosome
haplotypes defined by 18 STR loci.Int.
J. Legal Med. 119, 303–305.
doi: 10.1007/s00414-005-0547-7
PubMed Abstract | CrossRef Full Text | Google Scholar
Rosser, Z. H., Zerjal, T., Hurles,
M. E., Adojaan, M., Alavantic, D., Amorim, A., et al. (2000). Y-chromosomal diversity in Europe is clinal and influenced
primarily by geography, rather than by language. Am. J. Hum. Genet. 67, 1526–1543. doi: 10.1086/316890
CrossRef Full Text | Google Scholar
Soltyszewski,
I., Pepinski, W., Spolnicka, M., Kartasinska, E., Konarzewska, M., and Janica,
J. (2007). Y-chromosomal haplotypes for the AmpFlSTR Yfiler PCR Amplification
Kit in a population sample from Central Poland. Forensic Sci. Int.168, 61–67. doi:
10.1016/j.forsciint.2006.01.009
PubMed Abstract | CrossRef Full Text | Google Scholar
Soltyszewski,
I., Plocienniczak, A., Fabricius, H. A., Kornienko, I., Vodolazhsky, D.,
Parson, W., et al. (2008). Analysis of forensically used autosomal short tandem
repeat markers in Polish and neighboring populations. Forensic Sci. Int. Genet. 2, 205–211. doi:
10.1016/j.fsigen.2008.02.003
PubMed Abstract | CrossRef Full Text | Google Scholar
Spolnicka,
M., Dabrowska, J., Szablowska-Gnap, E., Paleczka, A., Jablonska, M.,
Zbiec-Piekarska, R., et al. (2017). Intra- and inter-population analysis of
haplotype diversity in Yfiler((R)) Plus system using a wide set of
representative data from Polish population. Forensic Sci. Int.
Genet. 28, e22–e25. doi:
10.1016/j.fsigen.2017.01.014
PubMed Abstract | CrossRef Full Text | Google Scholar
Strapagiel,
D., Sobalska-Kwapis, M., Słomka, M., and Marciniak, B. (2016). Biobank
Lodz - DNA Based Biobank at the University of Lodz, Poland. Open J. Bioresour. 3:e6.
Tam,
V., Patel, N., Turcotte, M., Bosse, Y., Pare, G., and Meyre, D. (2019).
Benefits and limitations of genome-wide association studies. Nat. Rev. Genet. 20,
467–484. doi: 10.1038/s41576-019-0127-1
PubMed Abstract | CrossRef Full Text | Google Scholar
Trzeciecki,
M. (2016). The Past Societies. Vol. 5. 500AD - 1000AD. Warsaw: Institute of Archaeology and
Ethnology.
Wang,
J., Samuels, D. C., Shyr, Y., and Guo, Y. (2017). StrandScript: evaluation of
Illumina genotyping array design and strand correction. Bioinformatics 33,
2399–2401. doi: 10.1093/bioinformatics/btx186
PubMed Abstract | CrossRef Full Text | Google Scholar
Wolanska-Nowak,
P., Branicki, W., Parys-Proszek, A., and Kupiec, T. (2009). A population data
for 17 Y-chromosome STR loci in South Poland population sample–some DYS458.2
variants uncovered and sequenced. Forensic Sci. Int.
Genet. 4, e43–e44. doi:
10.1016/j.fsigen.2009.04.009
PubMed Abstract | CrossRef Full Text | Google Scholar
Wozniak,
M., Grzybowski, T., Starzynski, J., and Marciniak, T. (2007). Continuity of Y
chromosome haplotypes in the population of Southern Poland before and after the
Second World War. Forensic Sci. Int.
Genet. 1, 134–140. doi:
10.1016/j.fsigen.2007.01.003
CrossRef Full Text | Google Scholar
Wozniak,
M., Malyarchuk, B., Derenko, M., Vanecek, T., Lazur, J., Gomolcak, P., et al.
(2010). Similarities and distinctions in Y chromosome gene pool of Western
Slavs. Am. J. Phys. Anthropol. 142, 540–548. doi: 10.1002/ajpa.21253
PubMed Abstract | CrossRef Full Text | Google Scholar
Zastera,
J., Roewer, L., Willuweit, S., Sekerka, P., Benesova, L., and Minarik, M.
(2010). Assembly of a large Y-STR haplotype database for the Czech population
and investigation of its substructure. Forensic Sci. Int.
Genet. 4, e75–e78. doi:
10.1016/j.fsigen.2009.06.005
PubMed Abstract | CrossRef Full Text | Google Scholar
Zupan,
A., Vrabec, K., and Glavac, D. (2013). The paternal perspective of the
Slovenian population and its relationship with other populations. Ann. Hum. Biol. 40,
515–526. doi: 10.3109/03014460.2013.813584
PubMed Abstract | CrossRef Full Text | Google Scholar
Appendix A: Supplemental Data
Web Resources
BBMRI-ERIC Directory, https://directory.bbmri-eric.eu/
Python, https://www.python.org/
Scikit-learn, https://scikit-learn.org/sta
QGIS, http://qgis.org
Geodesic and Cartographic Documentation Center, https://gis-support.com/spatial-datasets-for-poland/
Google Maps Api, https://developers.google.com/maps
GenomeStudio, https://www.illumina.com/techniques/microarrays/array-data-analysis-experimental-design/genomestudio.html
StrandScript, https://github.com/seasky002002/Strandscript
European Genotype Archive, https://www.ebi.ac.uk/ega/
yHaplo, https://github.com/23andMe/yhaplo
International Society of Genetic
Genealogy. Y-DNA Haplogroup Tree 2016, http://www.isogg.org/tree/
Arlequin, http://cmpg.unibe.ch/software/arlequin35/
R, https://www.r-project.org/.
Keywords: Y-chromosome,
haplogroups, Polish population, regions of Poland, microarray analysis, SNPs
Citation: Grochowalski Ł, Jarczak J, Urbanowicz M, Słomka M, Szargut M,
Borówka P, Sobalska-Kwapis M, Marciniak B, Ossowski A, Lorkiewicz W and
Strapagiel D (2020) Y-Chromosome Genetic Analysis of Modern Polish Population. Front. Genet. 11:567309. doi: 10.3389/fgene.2020.567309
Received: 29 May 2020; Accepted: 27 August 2020;
Published: 23 October 2020.
Edited by:
Fulvio Cruciani, Sapienza University
of Rome, Italy
Reviewed by:
Hui Li, Fudan University,
China
Damir Marjanovic, Institute for
Anthropological Research, Croatia
Copyright © 2020 Grochowalski, Jarczak, Urbanowicz, Słomka, Szargut, Borówka,
Sobalska-Kwapis, Marciniak, Ossowski, Lorkiewicz and Strapagiel. This is an
open-access article distributed under the terms of the Creative Commons
Attribution License (CC BY). The use, distribution or
reproduction in other forums is permitted, provided the original author(s) and
the copyright owner(s) are credited and that the original publication in this
journal is cited, in accordance with accepted academic practice. No use,
distribution or reproduction is permitted which does not comply with these
terms.
*Correspondence: Dominik Strapagiel, dominik.strapagiel@biol.uni.lodz.pl